![[IUCr Home Page]](/iucr-top/logos/iucrhome.gif)
![[Commission Home Page]](/iucr-top/logos/cteach.gif)
![]()
![]()
![]()
Next: 7. Ternary Phase Diagrams
Up: The Study of Metals and Alloys
Previous: 5. Accurate Cell Dimensions
We now come to the main purpose of this article - the application of the foregoing methods to the study of phase diagrams.
A binary alloy can have four different types of constitution:
(a) A mixture of two immiscible phases (fortunately this is rare).
(b) A single phase in which atoms of both sorts occupy positions on the same lattice - a solid solution .
(c) A phase with structure different from that of either of the constituents - an intermetallic compound .
(d) An intimate mixture of two phases - a two-phase alloy .
There cannot be more than two phases in equilibrium in general.
Solid solutions are very common. If they include one of the elements they are said to be primary ; otherwise they are secondary . If the two elements have the same structure, such as copper and nickel, the solid solution may extend from one to the other. But most systems have a succession of solid solutions and intermetallic compounds, as exemplified in Fig. 6. The ranges of the various phase fields almost always vary with temperature.
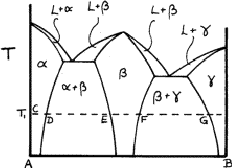 |
Figure 6 is called a phase diagram . The two elements are designated A
and B, and near to A we can see that a solid solution ![]() of B in A
is formed; at temperature T, this extends from C to D. At D
of B in A
is formed; at temperature T, this extends from C to D. At D ![]() is
saturated with B, and more of metal B causes a second phase
is
saturated with B, and more of metal B causes a second phase ![]() to form;
the two-phase region
to form;
the two-phase region ![]() extends from D to E. Between E and
F only
extends from D to E. Between E and
F only ![]() is present, and from F to G there is another two-phase
region
is present, and from F to G there is another two-phase
region ![]() . Finally, there is another solid solution,
. Finally, there is another solid solution, ![]() , of
A atoms in B.
, of
A atoms in B.
The region ![]() may be so narrow that no variation of composition is
observable;
may be so narrow that no variation of composition is
observable; ![]() is almost a chemical compound. The various phase fields
-
single-phase and two-phase - usually vary with temperature and sometimes another
structure appears at higher temperatures. The liquid L is such a phase, but
we shall not deal with this phenomenon here; X-ray methods are of little use in
dealing with liquids.
is almost a chemical compound. The various phase fields
-
single-phase and two-phase - usually vary with temperature and sometimes another
structure appears at higher temperatures. The liquid L is such a phase, but
we shall not deal with this phenomenon here; X-ray methods are of little use in
dealing with liquids.
The object of metallographic research is to measure the extents of the various single-phase and two-phase regions at different temperatures.
The first step in examining alloys of two metals is to establish the structures of these metals; this is usually easy as metals often have one of the structures whose patterns are shown in Fig. 4. Then we examine how far the regions of solid solution extend. This we can do by taking photographs of alloys of different compositions near to the elements and seeing when extra lines of a new phase appear.
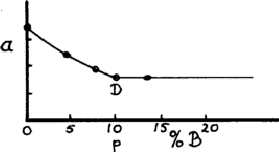
This however is only rough. To find accurately a point such as D, we plot a graph of lattice parameter a against composition (assuming that the structure is cubic), then measure the lattice parameter of the same phase in any two-phase alloy; in a two-phase region the compositions of the two phases are fixed and only the proportions change. The boundary point D is given by the point on the graph where the two-phase lattice parameter lies (Fig. 7).
To find the equivalents of the point D at different temperatures we must heat the alloy in bulk until equilibrium is attained. (The time needed would have to be found by trial and error - that is, by finding times that give consistent results.) Powder is then taken from the alloy, and this has to be annealed again at the same temperature to remove the effects of cold work (Section 1). The powder should be in a small container that can be suddenly plunged into cold water (quenched), with the hope that the high-temperature structure is preserved. No precise rules can be given as much depends upon the properties of the alloy system considered.
A more straightforward method is to take photographs at the required temperatures, but this requires specialized high-temperature cameras which may not be available. The quenching procedure should always be tried first.
There are many problems in this type of work, and no account can deal adequately with all of them. Finding the right conditions is usually a research in itself and X-ray methods can often help to shorten the time of investigation. For example, lack of equilibrium usually leads to broadened lines.
For alloys other than cubic the work is more complicated but the principles are the same. For a hexagonal structure two lattice parameters can be used and one can act as a check on the other. (It is hoped that they give the same answer!)
Copyright © 1984, 1998 International Union of Crystallography
IUCr Webmaster