
An introduction to direct methods
The most important phase relationships and their application in solving the phase problem
H. Schenk
Introduction
The term 'direct methods' is applied to that class of methods which seek directly to solve the phase problem by the use of phase relationships based on the observed intensities.
The object of this pamphlet is to familiarize the reader with the phase relationships used in Direct Methods, and to explain why they work and how they are used in practice. Some prior knowledge of the phase problem, the structure-factor equation and the application of Fourier theory in crystal-structure analysis is assumed.
Notation
H = Laue indices h k l of a reflection
K = Laue indices h1 k1 l1 of another reflection
![]() = Bragg angle of a reflection H
= Bragg angle of a reflection H
IH = intensity of a reflection H (![]() )
)
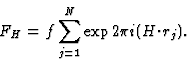
FH = the structure factor of H. In this work FH will be corrected for thermal motion and brought onto an absolute scale.
EH = normalised structure factor of H
UH = unitary structure factor of H
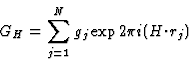
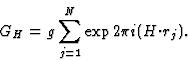
GH = structure factor of H based on the squared structure
![]() = phase of reflection H
= phase of reflection H
N = number of atoms in the unit cell
fj = scattering factor of atom j
Zj = atomic number of atom j
rj = position of atom j in vector notation
xj, yj, zj = position of atom j in Cartesian coordinates
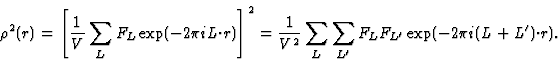
E3 = N-1/2|EHEKE-H-K|
E4 = N-1|EHEKELE-H-K-L|
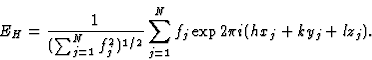
Strong and weak structure factor magnitudes FH
If, in a crystal structure, atoms lie in the neighbourhood of a set of planes H, as indicated in Fig. 1a, then reflection by planes H is strong and hence the intensity IH is large. Of course, the converse is also true: if one observes a large intensity IH, then the atoms lie near planes as indicated in Fig. 1a. This statement follows also from the structure-factor expression:
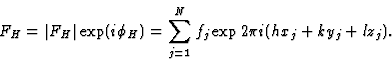
A large FH will be found if (hxj + kyj + lzj) mod 1 is approximately constant for all j; or, in other words, if all atoms lie near one of the planes H. The phase ![]() depends on the value of the constant and changes with the origin.
depends on the value of the constant and changes with the origin.
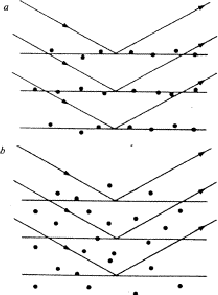 |
Conversely, a structure-factor magnitude |FH| is small, if the atoms are randomly distributed with respect to the planes H, as shown in Fig. 1b.
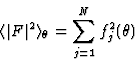
The electron density can be thought of as a superposition of density waves parallel to lattice planes, the amplitudes of which are the |FH|-values, the relative phases being given by the ![]() -values. We will see later that these density waves afford a physical picture of the phase relationships used in Direct Methods.
-values. We will see later that these density waves afford a physical picture of the phase relationships used in Direct Methods.
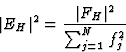
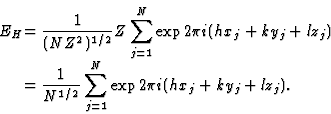
Normalized structure factors EH
Note: in this text FH designates the structure factor corrected for thermal motion and brought to an absolute scale; generally this is done using a Wilson plot. Since the scattering factor of any atom decreases for larger reflection angle ![]() , and the expected intensity
, and the expected intensity ![]() of a reflection is given by
of a reflection is given by
 |
(1) |
 |
(2) |
The structure-factor expression in terms of the normalized structure factor is then:
 |
(3) |
|
(4) |
In order to find the maximum value of |E|, let us consider an equal atom structure for which the structure factor (4) further reduces to
 |
(5) |
The unitary structure factor U was used extensively in the early literature on Direct Methods:
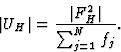 |
(6) |
| |EH|2 = N|UH|2. | (7) |
The |E|'s of H and 2H: the  relationship
The ![]() relation is the first phase relationship which will be considered here; it estimates in centrosymmetric space groups the phase of reflection 2H on the basis of the magnitudes |EH| and |E2H|. To start with, geometrical considerations will be applied to reflections with simple indices.
relation is the first phase relationship which will be considered here; it estimates in centrosymmetric space groups the phase of reflection 2H on the basis of the magnitudes |EH| and |E2H|. To start with, geometrical considerations will be applied to reflections with simple indices.
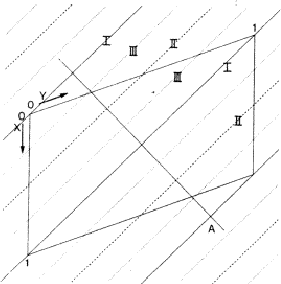
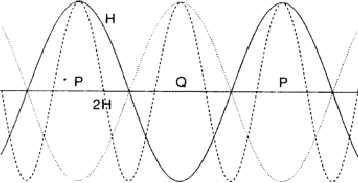
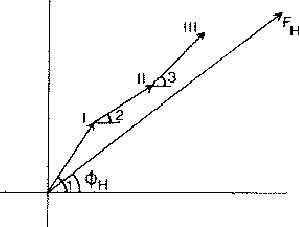
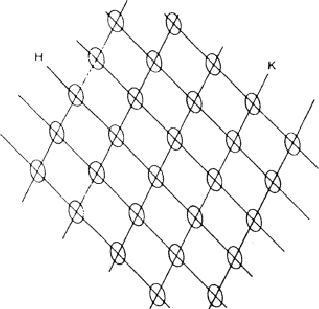
In a centrosymmetric crystal only phases of 0 and ![]() occur; provided that the phase of the 110 reflection is 0 the maxima of the associated electron density wave are found at the lines I of Fig. 2 and the minima at the lines II. If the phase of 110 is
occur; provided that the phase of the 110 reflection is 0 the maxima of the associated electron density wave are found at the lines I of Fig. 2 and the minima at the lines II. If the phase of 110 is ![]() , the maxima and minima are interchanged. The lines where the electron density wave has 0 value are marked with III. Thus in the event |E110| is large and
, the maxima and minima are interchanged. The lines where the electron density wave has 0 value are marked with III. Thus in the event |E110| is large and ![]() = 0, the electron density is mainly concentrated in the shaded areas of Fig. 3. For the electron density wave associated with the 220 reflection the maxima are found at both lines I and II in Fig. 2 in the case its phase is 0 and the minima at the lines III. Thus, when |E220| is large and
= 0, the electron density is mainly concentrated in the shaded areas of Fig. 3. For the electron density wave associated with the 220 reflection the maxima are found at both lines I and II in Fig. 2 in the case its phase is 0 and the minima at the lines III. Thus, when |E220| is large and ![]() = 0 the atoms must lie in shaded areas in Fig. 4. A similar drawing can be made for
= 0 the atoms must lie in shaded areas in Fig. 4. A similar drawing can be made for ![]() =
= ![]() .
.
 |
 |
 |
The combination of the two electron density waves associated with the reflections 110 and 220 leads to Fig. 5, in which in the areas I maxima are found of both density waves. In the areas II the maximum of 220 coincides with the minimum of 110, resulting in a low density. In the event that both reflections have a large |E| value it is likely that the atoms are concentrated in the double shaded area.
In case the phase ![]() =
= ![]() , the vertically shaded areas shift to the blank regions of Fig. 5 and then there is no overlap between the horizontally (110) and vertically (220) shaded areas; this implies that no position for the atoms can be found in which they contribute strongly to both structure factors. As a result for
, the vertically shaded areas shift to the blank regions of Fig. 5 and then there is no overlap between the horizontally (110) and vertically (220) shaded areas; this implies that no position for the atoms can be found in which they contribute strongly to both structure factors. As a result for ![]() =
= ![]() and
and ![]() = 0 it is not likely that both structure factor magnitudes |E110| and |E220| are large.
= 0 it is not likely that both structure factor magnitudes |E110| and |E220| are large.
 |
In conclusion, for large structure factors |E110| and |E220|, it is likely that ![]() = 0; this relationship is known as the
= 0; this relationship is known as the ![]() relation.
relation.
Up to now no attention is paid to the situation ![]() =
= ![]() , the reader is invited to show that this gives no change in the formulation of the
, the reader is invited to show that this gives no change in the formulation of the ![]() relation.
relation.
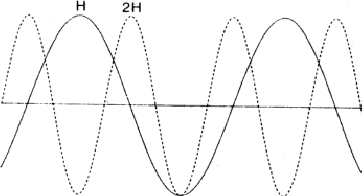
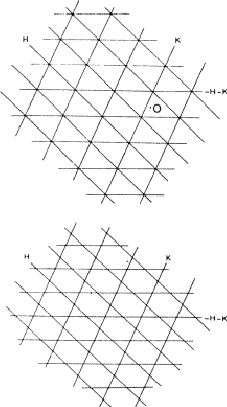
The comparison of H and 2H can be considered as a one-dimensional problem which can be understood by looking along line A in Fig. 2. In Fig. 6 the situation along this line is sketched with ![]() =
= ![]() = 0 while in Fig. 7
= 0 while in Fig. 7 ![]() = 0 and
= 0 and ![]() =
= ![]() . Areas labelled P in Fig. 6 denote regions of considerable positive overlap, whereas in Fig. 7 only regions of minor positive overlap are seen. The implication is that for large |EH| and |E2H| the situation depicted in Fig. 6 is more probably true and thus
. Areas labelled P in Fig. 6 denote regions of considerable positive overlap, whereas in Fig. 7 only regions of minor positive overlap are seen. The implication is that for large |EH| and |E2H| the situation depicted in Fig. 6 is more probably true and thus ![]() = 0. When
= 0. When ![]() =
= ![]() , as denoted by the dotted line in Fig. 6 the overlap areas marked Q show that
, as denoted by the dotted line in Fig. 6 the overlap areas marked Q show that ![]() is still zero.
is still zero.
 |
 |
The -relation from a Harker-Kasper inequality
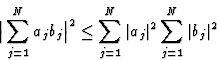
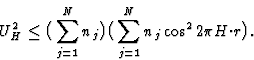
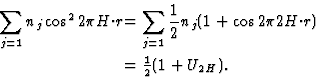
In 1948 Harker and Kasper published their paper on inequality relationships, which actually opened the field of direct methods. They applied the Cauchy inequality:
 |
(8) |
| (9) |
 |
(10) |
 |
(11) |
 |
(12) |
| (13) |
In case ![]() then
then ![]() or in other words the sign of reflection 2H is positive whatsoever its |U2H| value is. Note that the sign of H may have both values. In practice
or in other words the sign of reflection 2H is positive whatsoever its |U2H| value is. Note that the sign of H may have both values. In practice ![]() does not often occur. However, when |U2H| is large, expression (13) requires the sign of 2H to be positive even if UH is somewhat smaller than
does not often occur. However, when |U2H| is large, expression (13) requires the sign of 2H to be positive even if UH is somewhat smaller than ![]() . Moreover, when |UH| and |U2H| are reasonably large, but at the same time (13) is fulfilled for both signs of 2H, it is still more likely that S2H = + than that S2H = -. For example, for |UH| = 0.4 and |U2H| = 0.3, S2H = + leads in (13) to 0.16
. Moreover, when |UH| and |U2H| are reasonably large, but at the same time (13) is fulfilled for both signs of 2H, it is still more likely that S2H = + than that S2H = -. For example, for |UH| = 0.4 and |U2H| = 0.3, S2H = + leads in (13) to 0.16 ![]() 0.5 + 0.3 which is certainly true, and S2H = - to
0.5 + 0.3 which is certainly true, and S2H = - to ![]() which is also true. Then probability arguments indicate that still S2H = + is the more likely sign. The probability is a function of the magnitudes |UH| and |U2H| and in this example the probability of S2H = + being correct is
which is also true. Then probability arguments indicate that still S2H = + is the more likely sign. The probability is a function of the magnitudes |UH| and |U2H| and in this example the probability of S2H = + being correct is ![]() .In conclusion the mathematical treatment leads to the same result as the graphic explanation from the preceding paragraph: the
.In conclusion the mathematical treatment leads to the same result as the graphic explanation from the preceding paragraph: the ![]() relationship.
relationship.
Large |EH|, |EK| and |E-H-K|: the triplet relationship
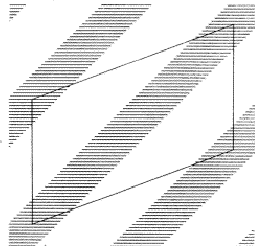
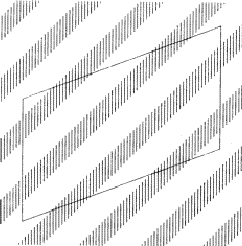
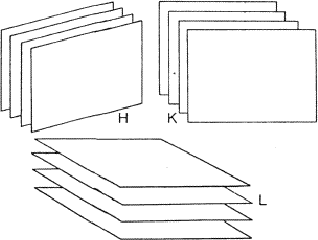
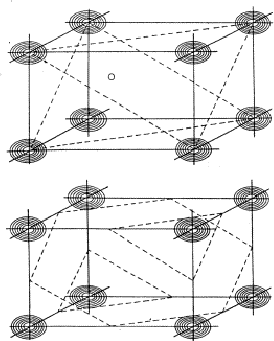
If two reflections H and K are both strong then the electron density is likely to be found in the neighbourhood of the two sets of equidistant planes defined by H and K. That is to say the electron density will be found near the lines of intersection of the planes H and K as indicated in projection in Fig. 9. A large |E| for reflection -H-K as well implies that the electron density will also peak in planes lying d-H-K apart. It is therefore most likely that these planes run through the lines of intersection of the planes H and K, in other words that the three sets of planes have their lines of intersection in common (see Fig. 10a). Then by choosing an origin at an arbitrary point the triplet phase relationship can be found from a planimetric theorem, proved in Fig. 11:
| AO/AD + BO/BE + CO/CF = 2 | (14) |
| (15) |
 |
 |
 |
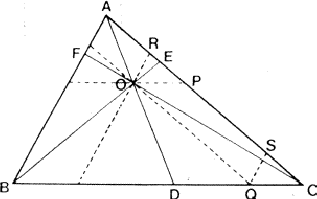 |
In Fig. 10a the ideal situation is sketched and of course a small shift of the planes of largest density of -H-K does not affect the reasoning given above. However, the most unlikely position for these planes is the one indicated in Fig. 10b; here the planes -H-K of largest electron density keep clear of the lines of intersection of H and K. The triplet relationship therefore has a probability character and this is emphasised by formulating it as
| (16) |
The triplet relation from Sayre's equation
The earliest formulation of the triplet-relation (10) for the centrosymmetric case was via Sayre's equation (Sayre, 1952). This equation can be derived from Fourier theory as follows.
The electron density can be written as
| (17) |
 |
(18) |
| (19) |
| (20) |
| (21) |
 |
(22) |
 |
(23) |
 |
(24) |
| (25) |
 |
(26) |
 |
(27) |
| (28) |
![]()
| (29) |
In the event that only a number of larger terms in (27) are available the scaling constant f/gV has no meaning. Nevertheless most likely the phase information included in these terms is correct and thus an expression such as
| (30) |
The so called tangent formula (Karle and Hauptman, 1956)
| (31) |
The positive quartet relation
The triplet relation, although a two-dimensional phase relation, is very successful in solving three-dimensional crystal structures. Nevertheless, it may be more appropriate to try to solve structures with three-dimensional phase relationships, the quartet relations.
The positive quartet relation is formulated as:
| (32) |
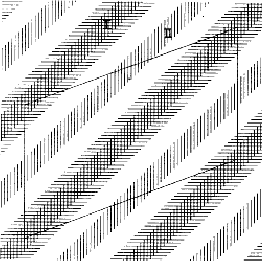
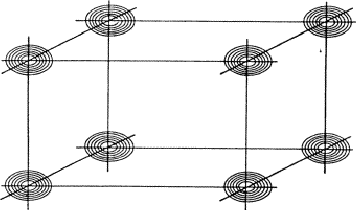
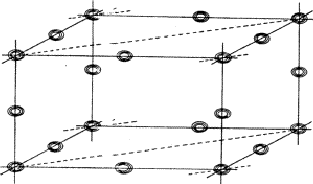
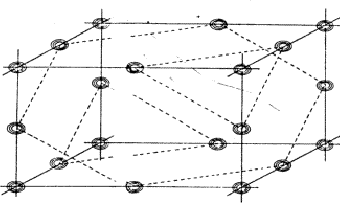
Analogous to the treatment of the triplet relation now three strong reflections H, K and L are combined and the electron density must be found in the sets of planes of Fig. 12. As a result the electron density will be found near the points of intersection of the three planes which are indicated for only a few planes from the sets in Fig. 13. For a strong reflection -H -K -L it is much more likely that its plane of maximum electron density will run through the points of intersection (Fig. 14a) than that it will clear these points (Fig. 14b). From Fig. 14a the quartet relation (32) follows as straightforward as the triplet relation from Fig. 10a (Schenk, 1981).
 |
 |
 |
This quartet relation, however, is not as strong as the triplet relation because of the factor N-1 in E4. It will be recalled that in E3 a term N-1/2 appears. The reliability is improved by combining the quartet with an identical one constructed from two triplets:
![]()
| (33) |
 |
The negative quartet relation
In the event that the sum of the four phases is equal to ![]() :
:
| (34) |
The planes of maximum for the 4 reflection involved in relation (34) are indicated in Fig. 16. It can be seen that for all indicated positions three out of four planes intersect. If atoms are located at these points the resulting unitary structure factors of H, K, L and -H-K-L will be 0.5, because three atoms lie in the planes and one lies halfway between. Thus for a negative quartet relation the reflections H, K, L and -H-K-L will in general not be found amongst the very strongest. The next question to be answered is: what is the intensity of reflection H + K, if the electron density is located near the marked points of Fig. 16? From Fig. 17 it can be easily seen that H + K will have a small |E|-magnitude: equal numbers of points of electron density concentration lie on the H + K planes and halfway in between. As the same holds for the other cross terms it can be stated that the negative quartet relation (34) is likely to be true for reasonably large values of E4 and small |EH+K|, |EH+L| and |EK+L|.
 |
 |
How numerous are the reliable triplets and quartets?
In the following table numbers of relations are given together with their percentage of correct indications for triplets, quartets and negative quartets above variable thresholds of respectively the triplet product E3 and a quartet product E*4 (Schenk, 1973). The numbers are given for an aza-steroid with N = 40, in space group ![]() .
.
|
|
|||||||
| Triplets | Positive quartets | Negative quartets | |||||
|
|
|
||||||
| E3 | no. relations | % correct relations | E4 | no. | % | no. | % |
|
|
|||||||
| 6.0 | 21 | 100 | 6.0 | 185 | 100 | ||
| 4.0 | 143 | 100 | 4.0 | 1213 | 100 | ||
| 3.0 | 353 | 100 | 3.0 | 3295 | 100 | 1 | 100 |
| 2.5 | 583 | 99.8 | 2.5 | 5813 | 99.8 | 2 | 100 |
| 2.0 | 980 | 99.7 | 2.0 | 10,006 | 99.5 | 17 | 100 |
| 1.5 | 1823 | 99.2 | 1.5 | 13,114 | 98.8 | 38 | 100 |
| 1.0 | 3395 | 96.9 | |||||
|
|
|||||||
As can be seen many relations are available to solve this small N = 40 structure. As a rule the number of useful triplets and quartets diminishes as N increases; this effect is quite noticeable for quartets.
One comment regarding the use of negative quartets. If phase relationships such as the triplet relation
![]()
![]()
Direct methods in action
The first direct method, by means of which structures were solved, was the symbolic addition method. This method originates from Gillis (1948), however, due to the work of Karle and Karle (1966) it developed to a standard method. The problem can be defined as how do we find m phases, provided there are n phase relationships (![]() )? In the first place a few (
)? In the first place a few (![]() 3) phases can be chosen to fix the origin and then, using phase relationships, new phases can be derived from these three. In general it will not be possible to phase all reflections in this way and hence a suitable reflection (large |E|, many relationships with large E3) is given a symbolic phase and again the relationships are used to find new phases in terms of the already known ones. Usually it will be necessary to choose several symbols in order to phase most of the strong reflections. Finally the numerical values of the symbols are determined (e.g. by using negative quartet relations) and from the known phases a Fourier map can be calculated. This process is known as the symbolic addition method. Most structures are now solved by multi-solution tangent refinement procedures, which use many starting sets of numerical phases and the tangent formula (31) to extend and refine the phases. The correct solution may then be selected by using figures of merit, based e.g. on the internal consistency of the triplet-relations, or on the negative quartets.
3) phases can be chosen to fix the origin and then, using phase relationships, new phases can be derived from these three. In general it will not be possible to phase all reflections in this way and hence a suitable reflection (large |E|, many relationships with large E3) is given a symbolic phase and again the relationships are used to find new phases in terms of the already known ones. Usually it will be necessary to choose several symbols in order to phase most of the strong reflections. Finally the numerical values of the symbols are determined (e.g. by using negative quartet relations) and from the known phases a Fourier map can be calculated. This process is known as the symbolic addition method. Most structures are now solved by multi-solution tangent refinement procedures, which use many starting sets of numerical phases and the tangent formula (31) to extend and refine the phases. The correct solution may then be selected by using figures of merit, based e.g. on the internal consistency of the triplet-relations, or on the negative quartets.
Additional literature
In the preceding chapters the main object was to clarify the basis of the present direct methods. In this chapter a brief guide to additional literature is given.
This triplet relation originates from the early fifties and was implicitly present in the important papers by Harker and Kasper (1948), Karle and Hauptman (1950) and Sayre (1952). For the cenytrosymmetric case it was explicitly formulated by Sayre (1952), Cochran (1952), Zachariasen (1952) and Hauptman and Karle (1953). The latter authors gave it its probability basis, which was independently derived by Kitaigorodsky (1954) as well. The noncentrosymmetric case was formulated first by Cochran (1955). Another useful expression related to the ![]() relation is the tangent formula (31) derived by Karle and Hauptman (1956).
relation is the tangent formula (31) derived by Karle and Hauptman (1956).
A very important development was the use of symbols for tackling the set of triplet relations (1) in order to find the phases. Symbols are assigned to unknown phases such that a successful phase extension can be carried out. Later in the process in most cases the numerical values of the symbols can be determined. The use of symbols was first introduced by Gillis (1948) and later successfully applied by Zachariasen (1952) and Rumanova (1954), but due to the work of Karle and Karle (1963, 1966) the method could develop to a standard technique in crystallography. In particular the first structure determination of a non-centrosymmetric structure (Karle and Karle, 1964) proved the value of direct methods. The method has recently been described in detail by J. Karle (1974) and Schenk (1980a). The latter gives also some exercises. For centrosymmetric structures the symbolic addition procedure has been automized amongst others by Beurskens (1965), Germain and Woolfson (1968), Schenk (1969), Ahmed (1970), Dewar (1970), and Stewart (1970).
In noncentrosymmetric structures the programming problems are much greater and therefore the number of successful automatic program systems is smaller, examples are the systems of Dewar (1970) and the interactive system SIMPEL (Overbeek and Schenk, 1978).
Nowadays most of the structures are solved by multisolution tangent refinement procedures, which use many sets of numerical phases to start with and the tangent refinement (31) to extend and refine the phases. The most widely used procedure of this sort is the computer package MULTAN (Germain and Woolfson, 1968; Main, 1978; Main, 1980).
The positive seven-magnitude quartet relation (32) was first formulated by Schenk (1973) and at the same time a two-dimensional analogue of the negative quartet relationship proved to be useful (Schenk and de Jong, 1973; Schenk, 1973b). The negative quartet in theory and practice was then published by Hauptman (1974) and Schenk (1974). In the latter paper the first Figure of Merit based on negative quartets was successfully formulated and tested. Theories concerning 7 magnitude-quartets were developed later, among which the one of Hauptman (1975) is best established. Applications of quartets include their use in starting set procedures and figures of merit, further brief details of which can be found in a recent review article (Schenk, 1980b).
References
Ahmed, F. R., in F. R. Ahmed (ed.), Crystallographic Computing, pp. 55- 57, Copenhagen, Munksgaard (1970).
Beurskens, P. T., Thesis, Utrecht (1965).
Cochran, W., Acta Cryst. 5 (1952), 65-68.
Cochran, W., Acta Cryst. 8 (1955), 473-478.
Dewar, R. B. K., in F. R. Ahmed (ed.), Crystallographic Computing, pp. 63-65, Copenhagen, Munksgaard (1970).
Germain, G. and Woolfson, M. M., Acta Cryst. B24 (1968), 91-96.
Gillis, J., Acta Cryst. 1 (1948), 174-179.
Harker, D. and Kasper, J. S., Acta Cryst. 1 (1948), 70-75.
Hauptman, H. and Karle, J., ACA Monograph No. 3, Pittsburgh, Polycrystal Book Service (1953).
Hauptman, H., Acta Cryst. A31 (1975), 680-687.
Hauptman, H., Acta Cryst. A30 (1974), 472-477.
Karle, I. L. and Karle, J., Acta Cryst. 16 (1963), 969-975.
Karle, I. L. and Karle, J., Acta Cryst. 17 (1964), 835-841.
Karle, J., in International Tables for X-ray Crystallography, Vol. IV, Section 6, pp. 337-358, Birmingham, The Kynoch Press (1974).
Karle, J. and Hauptman, H., Acta Cryst. 3 (1950), 181-187.
Karle, J. and Hauptman, H., Acta Cryst. 9 (1956), 635-651.
Karle, J. and Karle, I. L., Acta Cryst. 21 (1966), 849-859.
Kitaigorodskii, A. I., Dokl. Acad. Nauk SSSR 94 (1954); Trudy Inst. Crystallogr. 10 (1954), 27.
Main, P., in H. Schenk, R. Olthof, H. van Koningsveld and G. C. Bassi (eds.), Computing in Crystallography, pp. 93-107, Delft, University Press (1978).
Main, P., in R. Diamond, S. Ramasheshan and K. Venkatesan (eds.), Computing in Crystallography, pp. 800-813, I. A. S., Bangalore (1980).
Overbeek, A. R. and Schenk, H., in H. Schenk, R. Olthof, H. Van Koningsveld and G. C. Bassi (eds.), Computing in Crystallography, pp. 108-112, Delft, Delft University Press (1978).
Rumanova, I. M., Dokl. Acad. Nauk. SSSR 98 (1954), 399.
Sayre, D., Acta Cryst. 5 (1952), 60-65.
Schenk, H., Transactions of the Kon. Ned. Akad. Wet, Series 1, Vol. XXV, 5, Amsterdam, London, North-Holland Publishing Company (1969).
Schenk, H., Acta Cryst. A28 (1972), 412-422.
Schenk, H., Acta Cryst. A29 (1973a), 77-82.
Schenk, H., Acta Cryst. A30 (1974), 477-482.
Schenk, H., in R. Diamond, S. Ramashan and K. Venkatesan (eds.), Computing in Crystallography, pp. 700-722, I. A. S., Bangalore (1980a).
Schenk, H., Ibid. pp. 1000-1018 (1980b).
Schenk, H., Acta Cryst. A37 (1981), 573-578.
Schenk, H. and de Jong, J. G. H. Acta Cryst. A29 (1973), 31-34.
Stewart, J. M., in F. R. Ahmed (ed.), Crystallographic Computing, pp. 71-74, Copenhagen, Munksgaard (1970).
Zachariasen, W. H., Acta Cryst. 5 (1952), 68-73.