
Feature article
Deformed Penrose tiling and quasicrystals
One of the most remarkable developments in crystallography during the years in which I have been active in the field was the discovery in 1984 (Shechtman et al., 1984) of quasicrystals — materials displaying symmetries forbidden in classical crystallography. Given that the concepts of classical crystallography had held precedence for the best part of a century, not only was it remarkable that such materials could exist but also was it perhaps more remarkable that in diffraction experiments they produced Bragg-like peaks comparable in sharpness to those from ordinary crystals. Since their discovery these novel materials have been the subject of intense study by experimental and theoretical scientists, and a whole new field has emerged.
Although this new field was rather removed from the path that had already been set for my own research – namely single-crystal diffuse scattering and disorder – I was instantly entranced by the new discoveries and felt compelled to become involved in some way. I was particularly captivated by the tiling models, such as Penrose tiling (Penrose, 1974), that were used to aid the understanding of quasicrystalline structure. Such tilings provide an attractively simple conceptual extension of conventional crystallography. Instead of the normal repeating “unit cell” of a crystal there are now two different “tiles” (e.g. a fat and a thin rhombus in 2D), each of which can be decorated by an arrangement of atoms. In addition, I found the tiling patterns themselves aesthetically very appealing.
The “matching rules”, which define the ways tiles can be assembled to form the Penrose pattern, ensure that the structure is coherent and locally consistent across tile boundaries. Unfortunately, real quasicrystals do not correspond exactly to this tiling picture, although the correspondence may sometimes be quite close. A tiling model may give sharp Bragg reflections at points corresponding to the observed quasicrystal diffraction peak positions, but it is not possible to decorate the two types of tiles in a way that reproduces the observed Bragg peak intensities (Steurer, 2004). The tiling analogy has nevertheless remained useful in exploring many other aspects of quasicrystals and their relationship to normal crystals.
One area that I found of particular interest was that the basic Penrose pattern could be subject to local deformations rather akin to the local “size-effect” distortions that have played an important role in many of our studies of diffuse scattering in crystals. These deformations in quasicrystals may be described in terms of mathematical constructions called “deformed model sets” (Hof, 1997; Bernuau & Duneau, 2000; Baake & Sing, 2004; Baake & Lenz, 2005; Sing & Welberry, 2006). Examples of deformed model sets may be constructed by simple prescription and contain no randomness. They give diffraction patterns that have sharp Bragg peaks and no diffuse scattering. Nevertheless both the tiling pattern and its diffraction pattern may be very different from the original undeformed pattern. Such constructions lead to many new, interesting and aesthetically pleasing patterns.
![[Fig.1 quasicrystals]](https://www.iucr.org/__data/assets/image/0016/145024/Fig1_quasicrystals.jpg) Figure 1. (a) Small region of Penrose tiling showing the four different kinds of vertex
[circle (red), square (black), triangle (green) and star (pink)]. (b) The rhombicicosahedron internal space projection window showing the four planes (A, B, C and D) from which the different vertices derive.
Figure 1. (a) Small region of Penrose tiling showing the four different kinds of vertex
[circle (red), square (black), triangle (green) and star (pink)]. (b) The rhombicicosahedron internal space projection window showing the four planes (A, B, C and D) from which the different vertices derive.
![[Fig. 2 quasicrystals]](https://www.iucr.org/__data/assets/image/0019/145027/Fig2_quasicrystals.jpg) Figure 2. (a) Different types of tile cluster. Arrows represent the displacement vectors ν1, ν2, ν4, ν5, ν6 and ν7 (see text). (b) The small (A and D) and large (B and C) pentagonal sections from the projection volume showing the subregions that give rise to the eight different types of cluster shown in (a). Clusters 1 to 3 derive from A and D while 4 to 8 derive from B and C.
Figure 2. (a) Different types of tile cluster. Arrows represent the displacement vectors ν1, ν2, ν4, ν5, ν6 and ν7 (see text). (b) The small (A and D) and large (B and C) pentagonal sections from the projection volume showing the subregions that give rise to the eight different types of cluster shown in (a). Clusters 1 to 3 derive from A and D while 4 to 8 derive from B and C.
Construction of deformed Penrose tiling patterns
2D Penrose rhomb tiling may be obtained by projection from 5D hypercubic space following the method described by Yamamoto & Ishihara (1988). A small region of this tiling is shown in Fig. 1a. Using this projection method, each vertex of the 2D tiling pattern (in the physical space) derives from a point within the 3D projection window (in the internal space). Here, the projection window is the rhombic icosahedron (Fig. 1b) and the four different types of vertex (circle, square, triangle and star) derive from points that lie in the four (shaded) pentagon-shaped plane sections A, B, C and D. If the local environment of any given vertex is considered, it is found that there are eight different kinds of configuration (clusters) possible (each with its symmetry equivalents) (Fig. 2a). Each of these cluster types derives from a point lying in a given subregion of the projection pentagons. Fig. 2b shows the different subregions that give rise to the different cluster types.
The Penrose tiling pattern that is obtained by the projection method can be deformed in such a way that it remains pure point diffractive. Each vertex in real (physical) space is displaced from its ideal position by an amount νi in a direction ϕi where νi and ϕi are given by a function defined in the internal space window. We use a simple function in which it is assumed that νi and ϕi are constant over the area of each subregion of the two pentagons shown in Fig. 2b. It is assumed that the direction ϕi = 0 corresponds to the direction drawn in each cluster figure of Fig. 2a and rotates with each symmetry equivalent cluster to remain along the mirror plane of the cluster. The six different νi corresponding to regions 1, 2, 4, 5, 6 and 7 may each be chosen independently but it is assumed that symmetry-equivalent regions have identical values, ensuring overall symmetry is maintained. As a displacement of vertex 3 or 8 would break local symmetry it is assumed that ν3 = ν8 = 0.
![[Fig. 3 quasicrystals]](https://www.iucr.org/__data/assets/image/0020/145028/Fig3_quasicrystals.jpg) Figure 3. Regions of (a) undeformed Penrose tiling and (b) and (c) deformed tilings, together with their computed diffraction patterns. Remarkably, all three of these diffraction patterns have the same Bragg peak positions yet extremely different intensity distributions – and none of them show diffuse scattering.
Figure 3. Regions of (a) undeformed Penrose tiling and (b) and (c) deformed tilings, together with their computed diffraction patterns. Remarkably, all three of these diffraction patterns have the same Bragg peak positions yet extremely different intensity distributions – and none of them show diffuse scattering.
Despite the simplicity of the deformation function defined above there are 12 parameters that may be chosen independently: ν1, ν2, ν4, ν5, ν6, ν7 and ϕ1, ϕ2, ϕ4, ϕ5, ϕ6, ϕ7, each representing a displacement magnitude or a displacement direction for one of the non-fivefold symmetric cluster types (Fig. 2). We present here just two contrasting examples to show how the deformation works. Quite large values of the displacements have been used to produce the most striking visual effects but it should be remembered that a continuous range of values is possible from the Penrose pattern for which all displacement parameters are zero (Fig. 3a) through to these more extreme cases. The magnitudes of the displacements given are on a scale for which the edge length for the Penrose rhombs was 1/τ Å where τ ≃ 1.618 is the golden ratio.
Example 1. ν1 = ν2 = ν4 = ν5 = ν6 = ν7 = −0.4; all ϕi = 0.0. The results for this set of parameters are shown in Fig. 3b. Reference to Fig. 2a shows that setting all the displacements to be negative “closes up” what were thin rhombs while in the main enlarges what were fat rhombs. The real space pattern thus has a predominance of the blue (light) colour, with a small amount of red (dark) in the interstices. Instead of only two shapes for the original tiles the pattern is now composed of a multitude of different shapes and sizes more like cobblestones than tiles. Despite this seeming randomness the diffraction pattern still consists only of Bragg peaks, though with drastically altered intensities.
Example 2. ν1 = 0.8; ν2 = ν4 = 0.4; ν5 = ν6 = ν7 = 0.0; all ϕi = 0.0. The results for this set of parameters are shown in Fig. 3c. Now many of the original thin rhombs have been expanded giving a predominant overall red colour. These particular values were chosen in order to give some clusters the appearance of a blue five-pointed star in a red pentagon. Again the pattern is made up of a multitude of different shapes and sizes but again the diffraction pattern consists only of Bragg peaks and again has drastically altered intensities.
Tiling with variable deformation
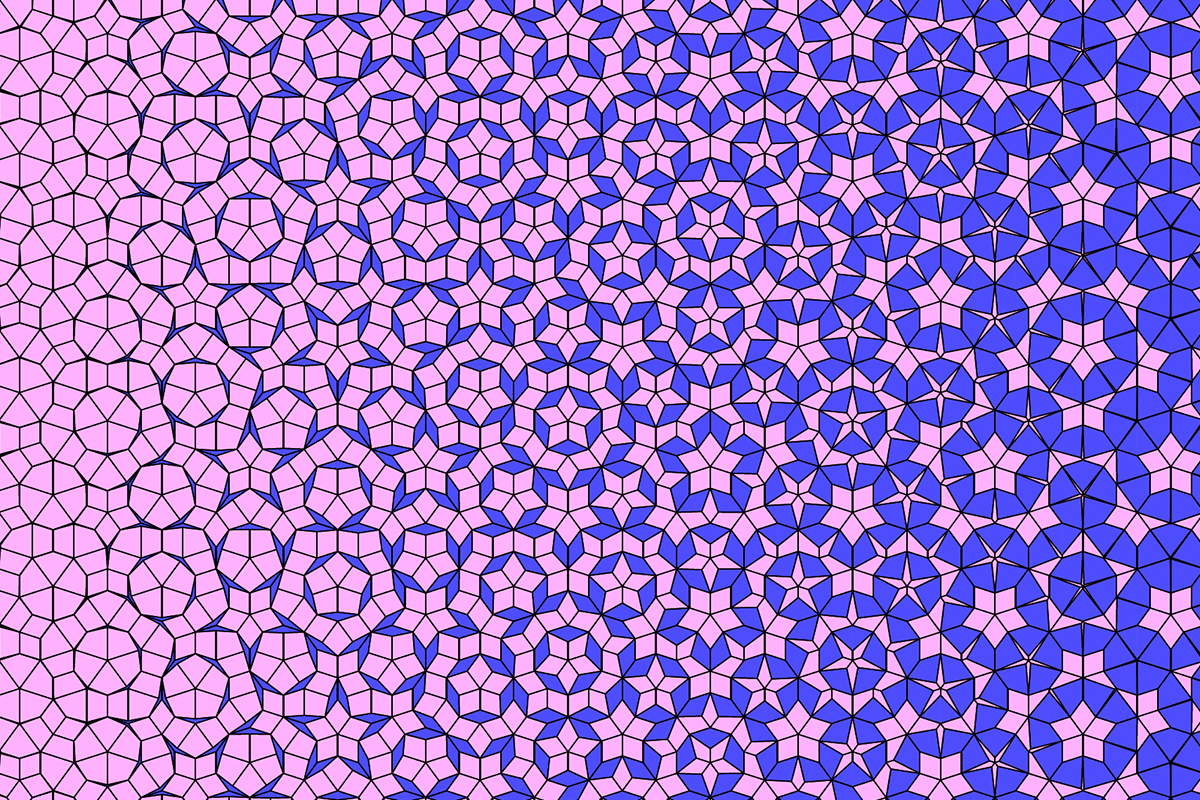
![[Fig. 4 quasicrystals]](https://www.iucr.org/__data/assets/image/0003/145029/Fig4_quasicrystals.png) Figure 4. A tiling pattern in which the deformation parameters have been varied linearly from left to right.
Figure 4. A tiling pattern in which the deformation parameters have been varied linearly from left to right.
Fig. 4 shows a pattern that has been produced by deforming a Penrose tiling using two sets of νi, ϕi parameters. At each horizontal position the value of the parameters is a linear combination of those that produce the pattern at the left extreme to those that produce the pattern at the right. In the middle the displacement parameters are zero and the pattern is the undeformed Penrose tiling. On the left the fat rhombs have been expanded, making the pattern appear predominantly pink while on the right the thin rhombs have expanded, making the pattern appear predominantly blue. This is my favourite pattern and one that I use in my Macintosh screensaver using the algorithm called “Origami” (see video).
In producing this pattern I admit to receiving inspiration from some of the drawings of M. C. Escher.
Richard Welberry ([email protected]) is Professor at the Research School of Chemistry, Australian National University, Canberra, Australia.
References
Baake, M. & Lenz, D. (2005). J. Fourier Anal. Appl. 11, 125–150.Baake, M. & Sing, B. (2004). Canad. Math. Bull. 47, 168–190.
Bernuau, G. & Duneau, M. (2000). Directions in Mathematical Quasicrystals, edited by M. Baake & R. Moody, CRM Monograph Series, 13, 43–60. Providence, Rhode Island: AMS.
Hof, A. (1997). In The Mathematics of Long-Range Aperiodic Order, edited by R. Moody, pp. 239–268. Dordrecht: Kluwer Academic Publishers.
Penrose, R. (1974). J. Inst. Math. Appl. 10, 266–271.
Shechtman, D., Blech, I., Gratias, D. & Cahn, J. (1984). Phys. Rev. Lett. 53, 1951–1953.
Sing, B. & Welberry, T. R. (2006). Z. Kristallogr. 221, 621–634.
Steurer, W. (2004). Z. Kristallogr. 219, 391–446.
Yamamoto, A. & Ishihara, K. (1988). Acta Cryst. A44, 707–714.
Copyright © - All Rights Reserved - International Union of Crystallography
