

History of crystallography
How did they do that? Beevers-Lipson strips

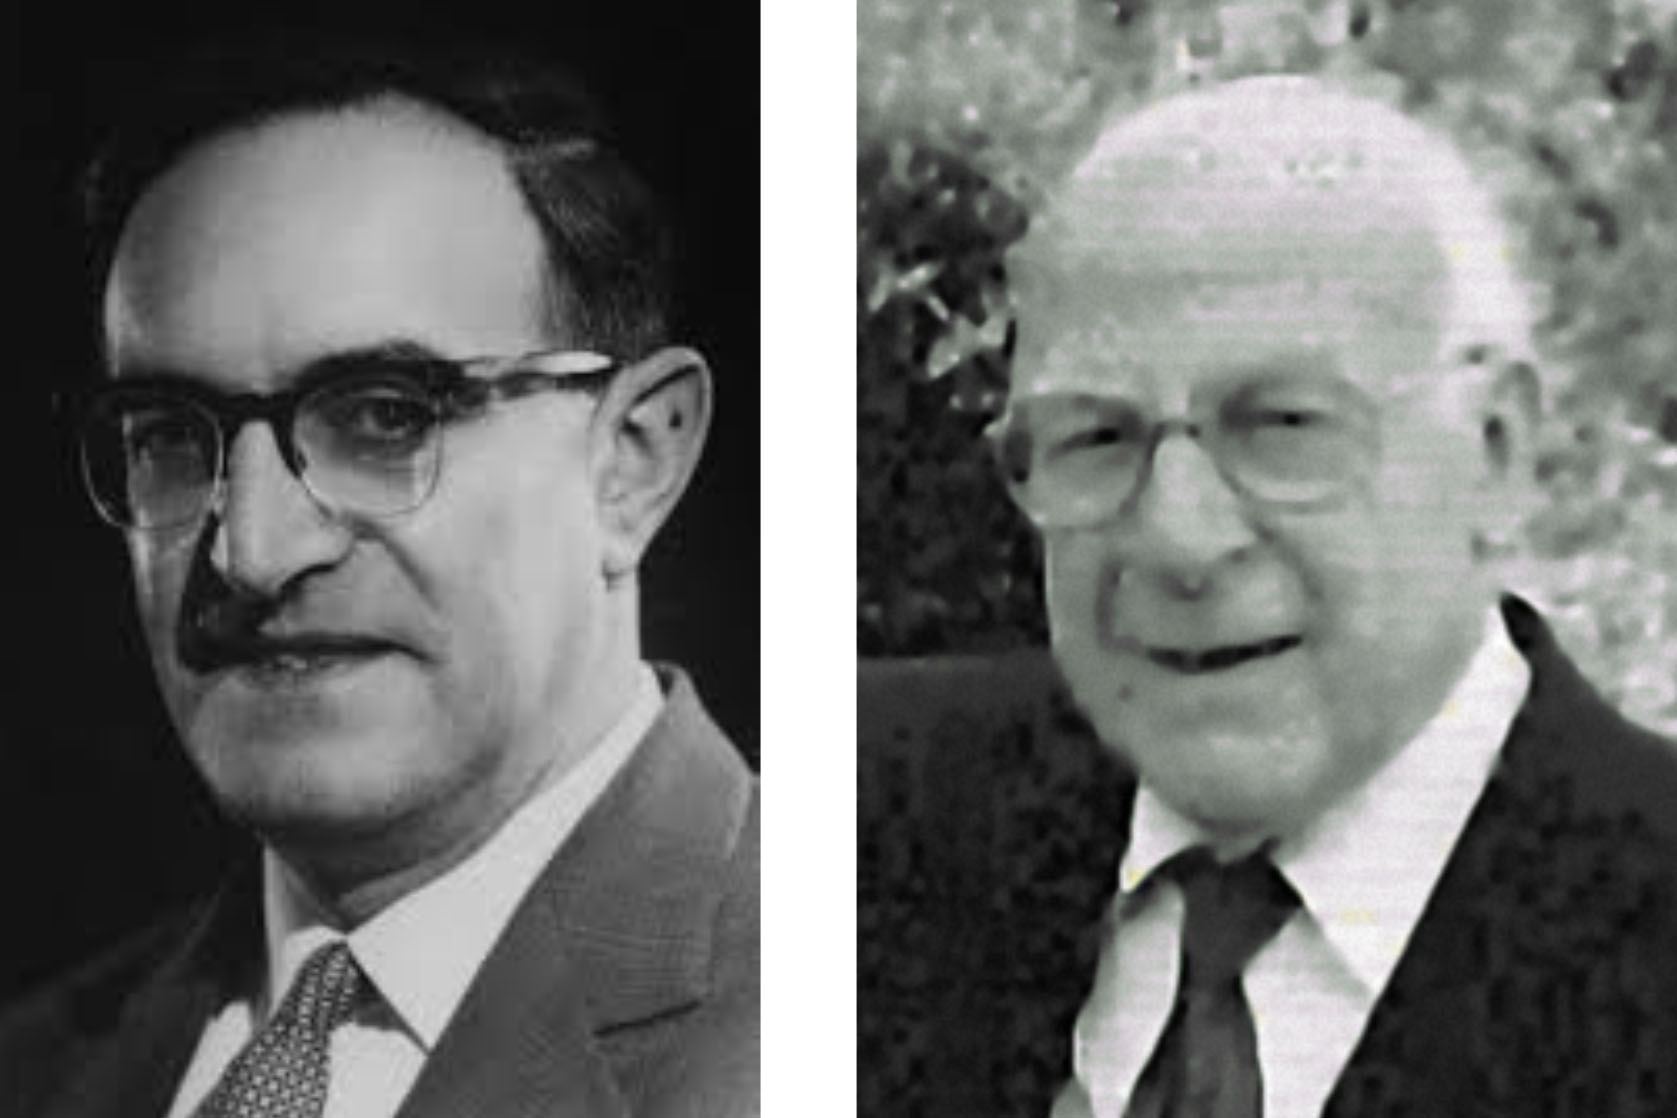
Henry Solomon Lipson (1910-1991) (left) and Cecil Arnold Beevers (1908-2001) (right)
The idea of using Fourier methods in crystallography was first proposed by William Henry Bragg in his Bakerian Lecture of 1915, but it was his son William Lawrence Bragg, who first used this procedure in his determination of the structure of diopside in 1928. In W. L. Bragg's own words[i]: I tried hard to see how all the reflections around a zone could be used to build a two-dimensional Fourier projection on a plane, but I missed the answer. It was provided by my father. He had been thinking about the same problem and wrote to me on my return, showing how the Fourier series should be formed but asking my advice as to whether the coefficients should be intensities or amplitudes. I replied that they should be amplitudes, and that I had sets of them obtained from diopside ready for trial. I put these coefficients in the Fourier series, summed it up, and behold there were the calcium, magnesium, silicon and oxygen atoms clearly shown by peaks in the Fourier summation. I wrote to my father with much excitement, and proposed that we should write a joint paper about it. He insisted that I should write it up alone, but I have always regretted that I agreed to do so. The idea as to how the Fourier series should be summed was entirely his, and I think he felt sad that the first paper describing its use should appear over my name. He should have published the idea, and I should have published its application to diopside. It was in this year that West and I published a paper on the analysis of structures with many parameters in which we summarised all we had learnt about techniques.
It was soon realized that in order to solve crystal structures of ever more complexity crystallographers would need to be able to add together huge numbers of trigonometric terms. The aim of adding Fourier terms is to produce maps showing electron density (in the case of X-rays) within a unit cell. I think it is worth looking back to understand how the early crystallographers tackled this problem, because then one can begin to appreciate just how clever they were in a much less technologically able world. Recall that until the 1960's the only practical way to find values of sines and cosines was by looking them up in printed tables or by the use of slide rules. No computers were available, nor calculators capable of computing trigonometric terms. Today, Fourier summation is taken for granted, and what used to take weeks to carry out can now be done in the blink of an eye. So how did they do it?
The story begins in Liverpool University with the collaboration of two research students, Cecil Arnold Beevers (1908-2001) and Henry Solomon Lipson FRS (1910-1991)[ii]. It had been proposed to them by a member of staff that they might like to work on the solution of crystal structures using X-ray diffraction. However, the availability of equipment then at Liverpool was limited and so the two students decided to approach W. L. Bragg at Manchester University for help. Bragg gladly agreed to help them, giving them access to his ionization spectrometer (a forerunner of the modern diffractometer), originally invented by his father. He also assigned one of his own students, Will Taylor[iii], to help them. In Lady Bragg's words: I remember how Lipson with his colleague C. A. Beevers, as young students working in Liverpool, used to come over to Manchester with their current crystal model to get help over the structure, and how Beevers used to bicycle all the way to save the fare.
Lipson and Beevers started to use Fourier techniques to solve the difficult case of the structure of copper sulfate pentahydrate[iv], the main problem being that the structure is of low symmetry in space group and so the oxygens are not located on special positions. Beevers calculated that the time taken to use 90 terms in two dimensions for calculation of a single point of electron density on a grid of 1000 points was about 90 minutes. At their present rate the work would have taken about one year to complete! It was then on 4 December 1933 that Lipson had a brainwave. To understand this recall that a two-dimensional electron-density projection on (001) can be expressed by a sum of Fourier terms thus:
![[equation (1)] [equation (1)]](https://www.iucr.org/__data/assets/image/0006/138606/image004.png) (1)
(1)
Lipson realized that this equation could be reformulated as:
![[equation (2)] [equation (2)]](https://www.iucr.org/__data/assets/image/0003/138612/image005.png) (2)
(2)
which can then be written simply thus:
![[equation (3)] [equation (3)]](https://www.iucr.org/__data/assets/image/0018/138600/image006.png) (3)
(3)
For a centrosymmetric structure:
![[equation (4)] [equation (4)]](https://www.iucr.org/__data/assets/image/0020/138602/image007.png) (4)
(4)
Similar expressions can be constructed for non-centrosymmetric crystal structures. The book[v] by Kathleen Lonsdale, if you can find it, deals with this well. This separation into separate one-dimensional summations along x and y directions made a huge reduction in calculation time. The idea was first published in 1934 in a paper entitled 'A rapid method for the summation of two-dimensional Fourier series'[vi]. Lipson then began writing down the cosine and sine solutions onto strips of paper at home with the help of his mother. There were originally 2079 cosine strips and 1980 sine strips at 6° intervals, but later strips were produced at 3° intervals to increase the resolution. How many of us today would have the patience to do this?
Each 6° strip then represented values for:
![[equation] [equation]](https://www.iucr.org/__data/assets/image/0009/138609/image008.png)
where A is an amplitude. To understand how to interpret such strips consider the following examples of cosine strips for k = 8 and k = 13.
![[cosine strips] [cosine strips]](https://www.iucr.org/__data/assets/image/0007/138598/image009.png)
On the first strip. the first number represents the value of the amplitude A = 29. The back of the strip has the value for -29. The second strip is for an amplitude of -43. In total, amplitudes were given up to a value of ±99. The letter C tells us that these are cosine strips and the following number, 8 or 13, is the value of k. There then follow 16 values corresponding to the index m from 0 to 15. As this covers one quarter of a cycle, the symmetry of the trigonometric function is used to find the values in subsequent quarters. For the next quarter one simply reverses the order.
Now in order to compute a Fourier summation, we start with a value for h, and all the strips corresponding to the different values of k are selected from the cosine box, and then laid one above the other on the table. It is then necessary to add the numbers down each column to obtain values for P(k). Then other values of h are chosen and the exercise repeated.This is repeated for strips taken from the sine box to obtain values of Q(k).
Let's take, as a simple example, the following set of structure factors with h = ±1 obtained by X-ray diffraction for a certain centrosymmetric cubic structure (the full table, not shown here, would list the structure factors for h and k = 0, ±1, ±2, ±3, ...).
| h | k | ±|F|/A | Multiplicity |
| 0 | 1 | -4 | 2 |
| 0 | 2 | 28 | 2 |
| 0 | 3 | -9 | 2 |
| 1 | 0 | -4 | 2 |
| 1 | 1 | 21 | 4 |
| 1 | 2 | -4.5 | 4 |
| 1 | 3 | 15.5 | 4 |
| 2 | 0 | 28 | 2 |
| 2 | 1 | -5 | 4 |
| 2 | 2 | 23 | 4 |
| 2 | 3 | -5 | 4 |
| 3 | 0 | -9 | 2 |
| 3 | 1 | 15 | 4 |
| 3 | 2 | -5 | 4 |
| 3 | 3 | 13 | 4 |
As this is centrosymmetric cubic we can write:
![[equation] [equation]](https://www.iucr.org/__data/assets/image/0003/138603/image010.png)
So, in order to deal with positive and negative values of h we calculate
![[equation] [equation]](https://www.iucr.org/__data/assets/image/0008/138608/image011.png)
in order to tabulate values of P(k) and Q(k), respectively. In this case, Q(k) = 0, and so there are no sine terms to consider.
This will be used as part of a (001) projection of the structure. We choose five strips from the cosine box and carry out the summations P(k) with k = 0, 1, 2, 3, 4 and taking h = 1.
![[equation] [equation]](https://www.iucr.org/__data/assets/image/0004/138604/extra_scheme.jpg) In practice, it was easy to make mistakes in the summations, and so it was usual to calculate checksums by totalling each row of values and comparing with the final row listing (illustrated here in bold at the right). The sums in this case correspond to values of P(k). These sums are then used in
In practice, it was easy to make mistakes in the summations, and so it was usual to calculate checksums by totalling each row of values and comparing with the final row listing (illustrated here in bold at the right). The sums in this case correspond to values of P(k). These sums are then used in
![[equation] [equation]](https://www.iucr.org/__data/assets/image/0020/138611/image040.png)
to get the electron density at all points x and y (see Table 2).
| 0 | 1 | 2 | 3 | 4 | 5 | 6 | 7 | 8 | 9 | 10 | 11 | 12 | 13 | 14 | 15 | |
| 120 C 1 | 120 | 119 | 117 | 114 | 110 | 104 | 97 | 89 | 80 | 71 | 60 | 49 | 37 | 25 | 13 | 0 |
| 117 C 1 | 117 | 116 | 114 | 111 | 107 | 101 | 95 | 87 | 78 | 69 | 59 | 48 | 36 | 24 | 12 | 0 |
| 108 C 1 | 108 | 107 | 106 | 103 | 99 | 94 | 87 | 80 | 72 | 63 | 54 | 44 | 33 | 22 | 11 | 0 |
| 94 C 1 | 94 | 93 | 92 | 89 | 86 | 81 | 76 | 70 | 63 | 55 | 47 | 38 | 29 | 20 | 10 | 0 |
| 76 C 1 | 76 | 76 | 74 | 72 | 69 | 66 | 61 | 56 | 51 | 45 | 38 | 31 | 23 | 16 | 8 | 0 |
| 56 C 1 | 56 | 56 | 55 | 53 | 51 | 48 | 45 | 42 | 37 | 33 | 28 | 23 | 17 | 12 | 6 | 0 |
| 35 C 1 | 35 | 35 | 34 | 33 | 32 | 30 | 28 | 26 | 23 | 21 | 18 | 14 | 11 | 7 | 4 | 0 |
| 16 C 1 | 16 | 16 | 16 | 15 | 15 | 14 | 13 | 12 | 11 | 9 | 8 | 7 | 5 | 3 | 2 | 0 |
| 0 C 1 | 0 | 0 | 0 | 0 | 0 | 0 | 0 | 0 | 0 | 0 | 0 | 0 | 0 | 0 | 0 | 0 |
| -12 C 1 | -12 | -12 | -12 | -11 | -11 | -10 | -10 | -9 | -8 | -7 | -6 | -5 | -4 | -2 | -1 | 0 |
| -19 C 1 | -19 | -19 | -19 | -18 | -17 | -16 | -15 | -14 | -13 | -11 | -10 | -8 | -6 | -4 | -2 | 0 |
| -21 C 1 | -21 | -21 | -21 | -20 | -19 | -18 | -17 | -16 | -14 | -12 | -11 | -9 | -6 | -4 | -2 | 0 |
| -18 C 1 | -18 | -18 | -18 | -17 | -16 | -16 | -15 | -13 | -12 | -11 | -9 | -7 | -6 | -4 | -2 | 0 |
| -11 C 1 | -11 | -11 | -11 | -10 | -10 | -10 | -9 | -8 | -7 | -6 | -6 | -4 | -3 | -2 | -1 | 0 |
| -1 C 1 | -1 | -1 | -1 | -1 | -1 | -1 | -1 | -1 | -1 | -1 | -1 | 0 | 0 | 0 | 0 | 0 |
| 10 C 1 | 10 | 10 | 10 | 10 | 9 | 9 | 8 | 7 | 7 | 6 | 5 | 4 | 3 | 2 | 1 | 0 |
The above table lists the electron-density contribution from reflections with h = 1 to all points in the Fourier map where x goes from 0 to 15/60.
Figure 1 shows a contour plot with just h = 1 made from the numbers in Table 2. The range of plot in each direction is from 0 to ¼ of the unit cell. This can be compared with Figure 1(b) which is an actual Fourier plot made with a modern Fourier plotting computer program using all the structures factors in Table 1, thus agreeing with our Beevers-Lipson calculation. Now, in order to obtain a complete Fourier plot it is necessary carry out the above procedure with all the values of h, i.e. with h = 0, 1, 2, 3... . Figure 1(c) shows the effect of adding the cosine fringes for a full set of structure factors for h,k from 0 to ±3 to get ρ(x,y). We thus obtain a low-resolution map of the electron density of a cubic perovskite structure. Further details on how the strips were used can be found in the books by Lipson & Cochran[viii] and by Woolfson[ix]. Note, in passing, that by using |F(hk0)|2 with strips from the cosine box alone, a Patterson map can be obtained. As can be seen, despite the simplification in equation (2), the process of using the strips was still complicated and time consuming.
Although the use of the strips cuts down the time factor enormously, I recall that when I started as a research student of Kathleen Lonsdale, together with the late Howard Flack, we were given a box of strips to compute a simple projection of hexamethylbenzene as an exercise. Even working together this took us a week to understand the process and then to obtain a low-resolution map! Restoring all the strips back into the box also took some considerable time. This exercise brought home to us just how much work was involved in computing Fourier maps before computers were widely available, and made us have considerable respect for the early crystallographers.
The idea for making available boxes of strips was published in 1936[x], in a paper in which Beevers and Lipson wrote: We should be glad to know if workers in other laboratories who employ the Fourier method would find these strips useful, as it may be possible for the supply of copies.
The publication of the so-called Beevers-Lipson strips caught on very quickly and around 500 sets were produced and exported all over the world and were in use even up to the 1970's. This was originally funded by a loan of £200 arranged by W. L. Bragg, in those days a considerable sum of money. Figure 2 shows the only remaining prototype box (cosine), which is in my possession, from which the others were derived. Unfortunately, the other box (sine) was thrown away by a colleague, before I could rescue it, during the move from the old Cavendish Laboratory to the new site in West Cambridge in 1974. Apparently, the original strips were written mainly at Lipson's home in the kitchen with his mother copying the negative amplitude numbers on the backs of the positive amplitude strips. I recently examined the strips closely and found that some were handwritten in pencil (see Figure 3) perhaps by Lipson's mother!
![[Fig.2] [Fig.2]](https://www.iucr.org/__data/assets/image/0005/138596/Figure2.jpg)
Figure 2. Prototype 6° cosine box of Beevers-Lipson strips. The boxes exported to other laboratories had sloping sides to ensure that when a strip was removed its place was left open for its re-insertion.
![[Fig.3] [Fig.3]](https://www.iucr.org/__data/assets/image/0007/138607/Figure3.jpg)
Figure 3. Some examples of handwritten Beevers-Lipson strips from the prototype cosine box.
Figure 4 shows Beevers together with Lipson's daughter Ann bathing in the sea during the 1951 IUCr Congress of Crystallography in Stockholm. This was one of two photographs that came to be known as 'Beevers-Lipson stripped'!
![[Fig.4] [Fig.4]](https://www.iucr.org/__data/assets/image/0006/138597/Figure4.jpg)
Figure 4. Beevers-Lipson stripped! (with thanks to Ann Lipson, deceased March 2017).
The boxes of Beevers-Lipson strips were used extensively to solve many important crystal structures. For example, the solution of the structure of penicillin by the Nobel Prize winner Dorothy Hodgkin was made possible by using the strips in order to create Fourier and Patterson maps showing the atomic positions. A look through copies of Acta Crystallographica from 1948 shows many examples of structures and Fourier maps made with Beevers-Lipson strips.
I should record here that Lipson went on to make many important contributions to crystallography. For instance, and largely forgotten, he showed with a student Vera Daniel in 1942 that extra powder lines observed in an alloy of copper, iron and nickel by A. J. Bradley could be interpreted in terms of having a modulated (or in today's terminology incommensurate) structure, see Figure 5.
![[Fig.5] [Fig.5]](https://www.iucr.org/__data/assets/image/0019/138601/Figure5.JPG)
Figure 5 Extra side-band powder diffraction lines observed in a Cu, Fe, Ni alloy by Daniel & Lipson in 1942[xi].
Figure 6 shows a photograph of Henry Lipson, Margaret Farquhar and Will Taylor in the Cavendish Laboratory in 1945. Lipson and Farquhar[xii] worked on the determination of precise lattice constants from powder diffraction. In 1957, Lipson was elected Fellow of the Royal Society.
![[Fig.6] [Fig.6]](https://www.iucr.org/__data/assets/image/0019/138610/Figure6.jpg)
Figure 6. H. S. Lipson, Margaret C. M. Farquhar, W. H. Taylor: Austin Wing, Cavendish Laboratory, Cambridge 1945.
In 1938 Beevers became Dewar Fellow in Crystallography at the University of Edinburgh, a post jointly associated with the Departments of Physics and Chemistry. Beevers was elected a Fellow of the Royal Society of Edinburgh later in the same year. He remained in Edinburgh for the rest of his life and was Reader in Crystallography at the University.
Arnold Beevers was a Quaker and this influenced his approach to life and science. He set up a company employing disabled workers. This was called Beevers Miniature Models (now Miramodus Ltd), which produced ball-and-spoke crystal structure models. It was possible to purchase completed models or to buy sets of miniature plastic balls (we used to call them Beevers' balls) in order to construct one's own models. Arnold was genial and a delightful entertainer. A famous joke that he used to play at conference dinners was to get the audience to sing the song 'My Bonnie Lies Over the Ocean' during which everyone had to stand up or sit down every time a word beginning with the letter B was sung. I well remember his invited lecture on crystal models at the IUCr Congress in Hamburg in 1984. Only Arnold could talk on such a topic and keep the audience entertained for such a long time.
[i] Crystal Clear: The Autobiographies of Sir Lawrence and Lady Bragg, edited by A. M. Glazer and P. Thomson, published by Oxford University Press (2015).
[ii] M. M. Woolfson, Biogr. Mems. Fell. R. Soc., 39, 228-244 (1994).
[iii] William (WHT) Hodge Taylor (1905-1979) had been a graduate student of WLB in 1926 and remained in Manchester until 1934. He then went to Cambridge to work with J. D. Bernal and then to the Davy-Faraday Laboratory to work under W. H. Bragg, before returning in 1936 to Manchester as Head of the Physics Department of the College of Technology. He was the first person to make a full description of the crystal structures of feldspars in 1933, one of the most common minerals on earth (and later found on the moon). He later moved to the Cavendish Laboratory in Cambridge with William Lawrence Bragg and was instrumental in running the newly created Crystallography Laboratory, where he remained until his retirement in 1971.
[iv] The same compound used to obtain the first X-ray diffraction photograph by Friedrich and Knipping in the Spring of 1912.
[v] K. Lonsdale. Crystals and X-rays. Bell & Sons (1948).
[vi] C. A. Beevers and H. Lipson. Phil. Mag. 17, 855-859.
[vii] A. M. Glazer. J. Appl. Cryst. 49, 2276-2278 (2016).
[viii] H. Lipson and W.Cochran. The Determination of Crystal Structures. Bell & Sons (1966).
[ix] M. M. Woolfson. An Introduction to X-ray Crystallography. Cambridge University Press (1970).
[x] C. A. Beevers and H. Lipson. Nature, 137, 825-826 (1936).
[xi] V. Daniel and H. Lipson. Proc. Roy. Soc. A, 181, 368-378 (1943).
[xii] M. C. M. Farquhar and H. Lipson. Proc. Phys. Soc. 58, 200 (1946).
Copyright © - All Rights Reserved - International Union of Crystallography


 and so the oxygens are not located on special positions. Beevers calculated that the time taken to use 90 terms in two dimensions for calculation of a single point of electron density on a grid of 1000 points was about 90 minutes. At their present rate the work would have taken about one year to complete! It was then on 4 December 1933 that Lipson had a brainwave. To understand this recall that a two-dimensional electron-density projection on (001) can be expressed by a sum of Fourier terms thus:
![[Fig.1] [Fig.1]](https://www.iucr.org/__data/assets/image/0005/138605/Figure1.jpg)


