An AVS/Express interface to CCP4
D. L. WildStructural Biology Laboratory, The Salk Institute, La Jolla, CA 92037, USA.
[email protected] S. Choe
Structural Biology Laboratory, The Salk Institute, La Jolla, CA 92037, USA.
[email protected]
Abstract
This paper describes the integration of programs from the widely used CCP4 macromolecular crystallography package into a modern visualization environment (AVS/Express), which provides a simple graphical user interface, a visual programming paradigm, and a variety of 1, 2 and 3-D data visualization tools for the display of graphical information and the results of crystallographic calculations, such as electron density and Patterson maps. The CCP4 suite comprises a number of separate Fortran 77 programs, which communicate via common file formats. Each program is encapsulated into an AVS/Express macro module, and may be visually linked to others in a network, reflecting the nature of many crystallographic calculations. Temporary files are used to pass input parameters from a graphical user interface to the program module, and also to intercept line printer output, which can be filtered to extract graphical information and significant numerical parameters. These may be passed to downstream modules, permitting calculations to be automated if no user interaction is required, or giving the user the opportunity to make selections in an interactive manner.
1 Introduction
Despite advances in the instrumentation and computer power available to crystallographers, the user interface to macromolecular crystallographic software has been neglected until fairly recently. Much of the crystallographic software used for macromolecular structure determination still retains the "card image" input format common in the early 70's when it was first written, although, as Frenz [1] points out, "mainstream" software has since advanced to dialogue, menus and windows as better means of user-computer interaction. Recently, a number of projects have been undertaken either to develop completely new packages based on the X-window system [2], or to develop X-window based interfaces to existing crystallographic software [3], [4], [5]. This paper describes an alternative approach to providing an integrated environment for a number of macromolecular crystallographic software packages, which includes a graphical user interface and data visualization tools. Initially programs from the Collaborative Computing Project 4 (CCP4) suite [6] have been interfaced.
1.1 Previous work
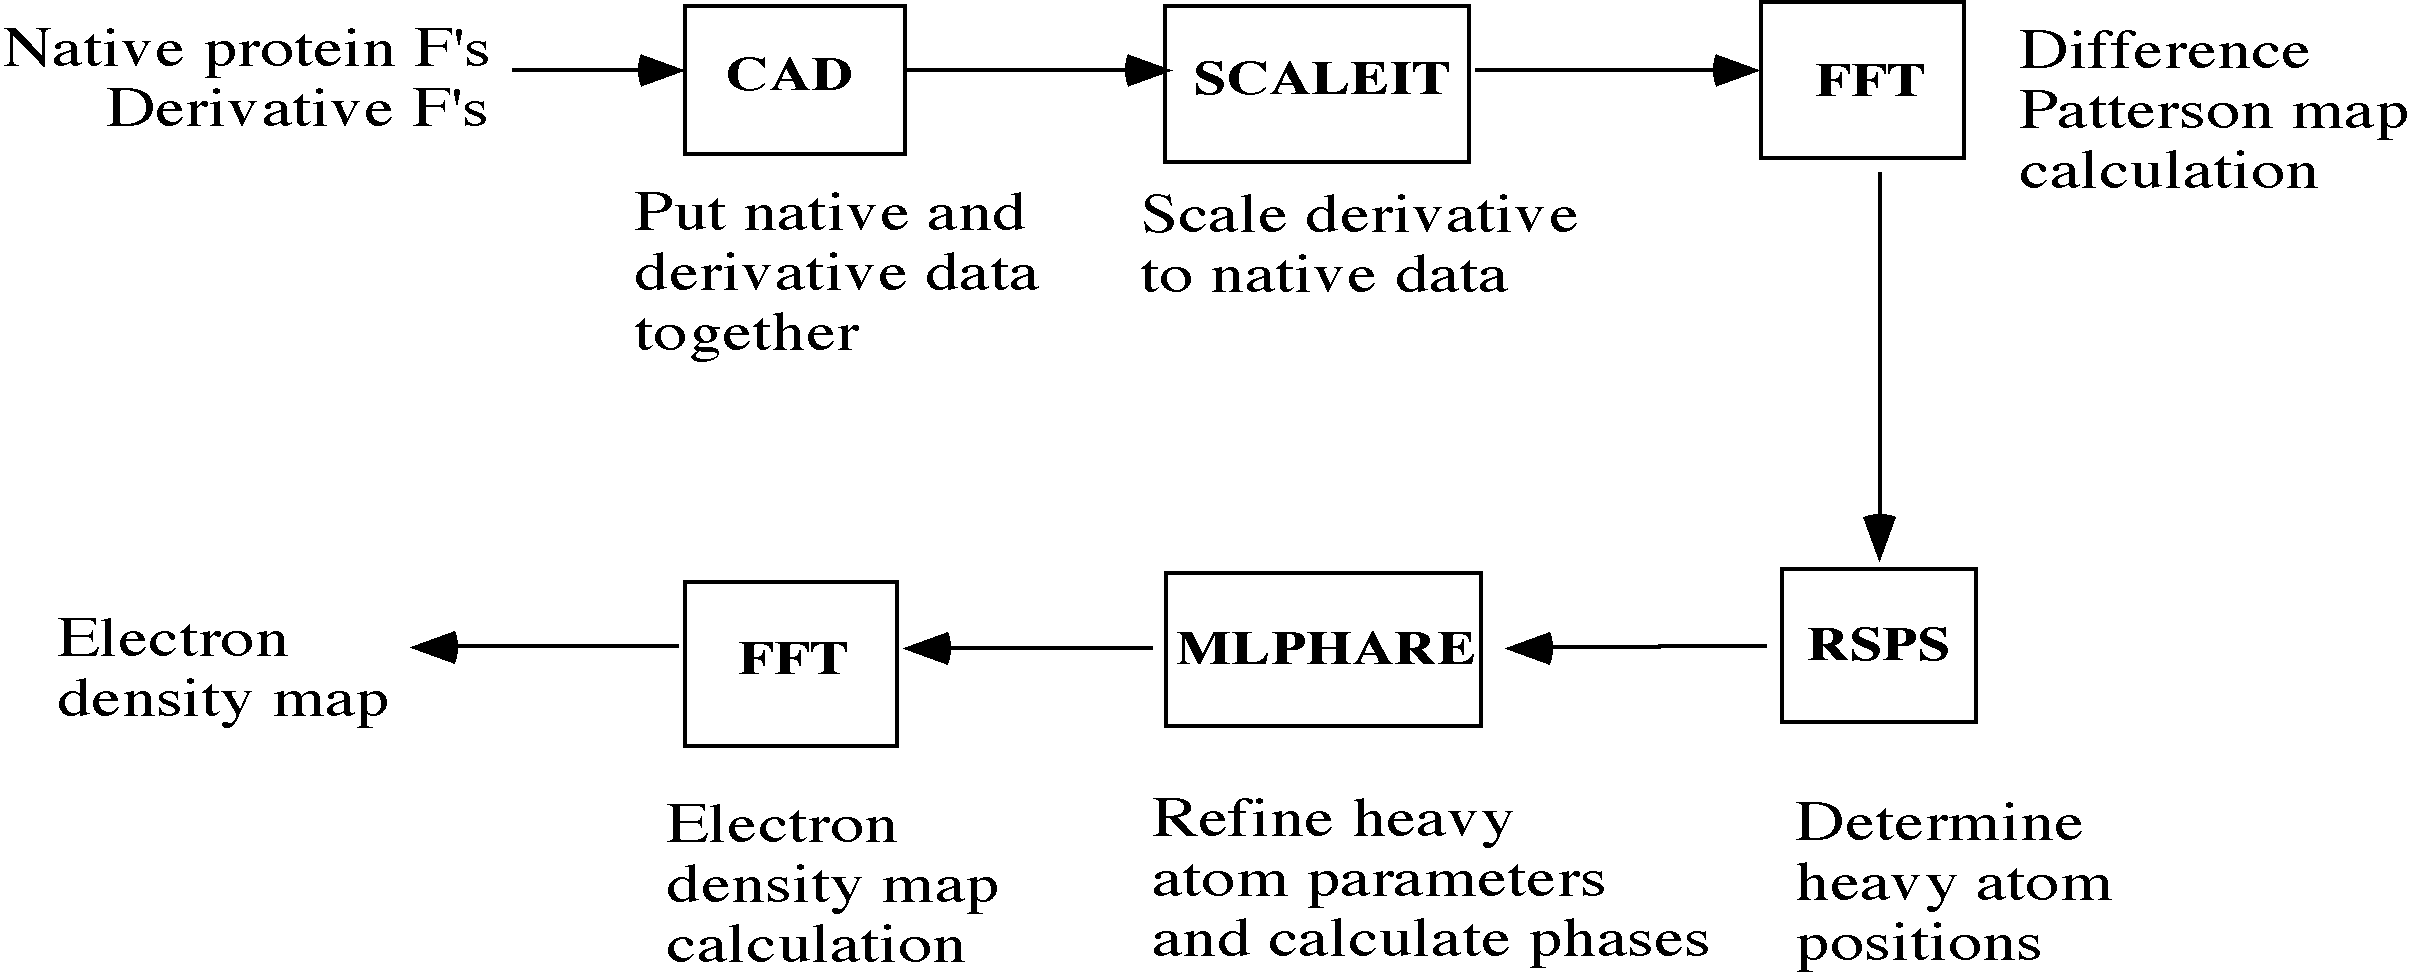
Unlike some other systems for macromolecular crystallography, which attempt to encompass all the required functions into one monolithic program, the CCP4 suite comprises a number of separate programs, written by different authors in standard Fortran 77, which communicate via common formats for structure factor, electron density map, and atomic coordinate data files. The suite contains programs which cover most aspects of macromolecular structure determination; data reduction, phasing by isomorphous and molecular replacement, least-squares refinement and structure analysis. As an example, Figure 1 illustrates the main steps involved in solving a crystal structure by isomorphous replacement, and the principal CCP4 programs used. A complete list of programs comprising the suite is given in reference [6].
Figure 1 Structure solution by isomorphous replacement using CCP4. Principal CCP4 programs used in each step are shown in boxes.
An important feature of the CCP4 suite is that individual programs may be combined in different ways to accomplish particular tasks. Input for each program is provided by a series of "control cards" comprising a leading keyword plus additional keyword/value pairs or numerical parameters. Since many crystallographic calculations involve a series of steps, using different programs, these are often chained together in a script or command file.
As Evans [7] points out, the advantage of this type of loose organization is that it is easy to add functionality or modify programs without interfering with the rest of the suite. Disadvantages include lack of consistency between programs, both in programming style and user interface, and the fact that the user must decide which operation to perform next. The latter disadvantages may be overcome by integrating the individual programs into an environment which presents the user with a consistent graphical user interface (GUI), and provides a number of prepackaged scripts for common tasks, whilst retaining the flexibility which allows the user to recombine programs in new ways. We have previously described our approach, which used a modern data flow visualization environment to perform these tasks [8]. In addition to being useful for visualization, the data flow model reflects the nature of crystallographic computing using a loosely organized package such as CCP4. Each module represents a single CCP4 program, and networks of programs may be constructed to perform particular tasks. Our initial work utilized one particular commercial environment (AVS version 5.02 [9]). We have recently ported our modules to the new AVS/Express environment [10], which retains the visual programming paradigm, based on linking networks of objects together, whilst providing a new object-oriented architecture.
2 Methods
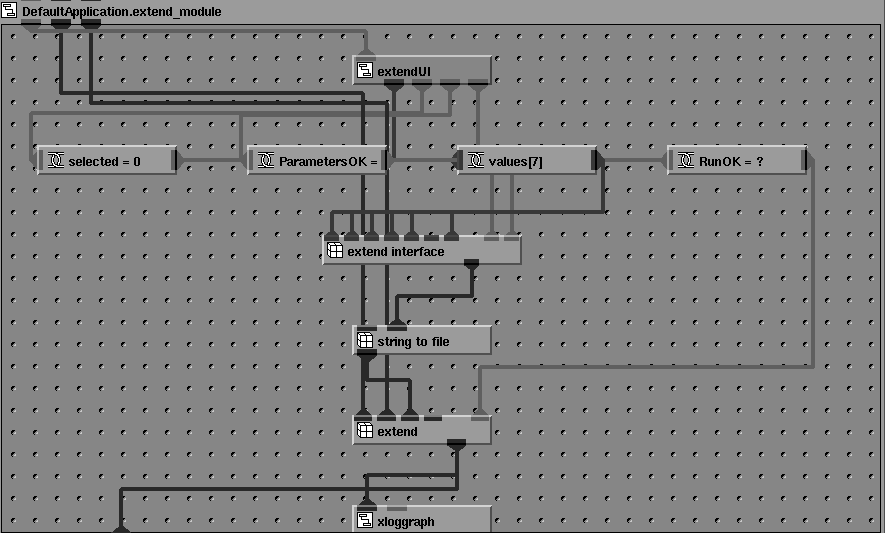
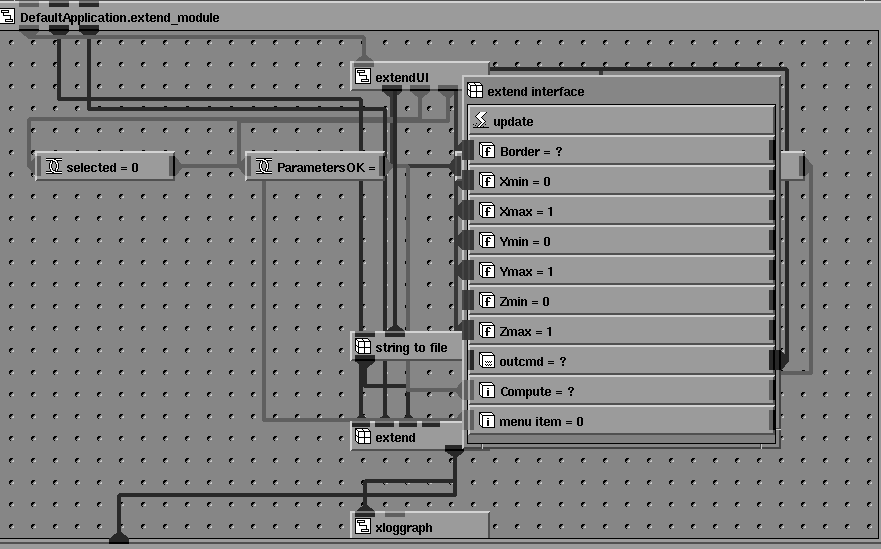
An approach to the modernization of "legacy" Fortran programs with card image input has been described by Albury [11]. The program can be considered as a "compute object" in a client-server environment. It receives a series of "messages" (input cards), processes the requests according to some algorithm, and replies with "response messages" (lines to an output file). Based on this approach, a number of CCP4 programs have been integrated into the AVS/Express environment. Each CCP4 program is encapsulated into an AVS/Express `macro object', which, in turn, comprises a network of lower level objects and connections. Each macro module is made up of a number of basic linked modules, as show in Figure 2.
Figure 2 Internal structure of an AVS/Express 'macro module' for the CCP4 program EXTEND.
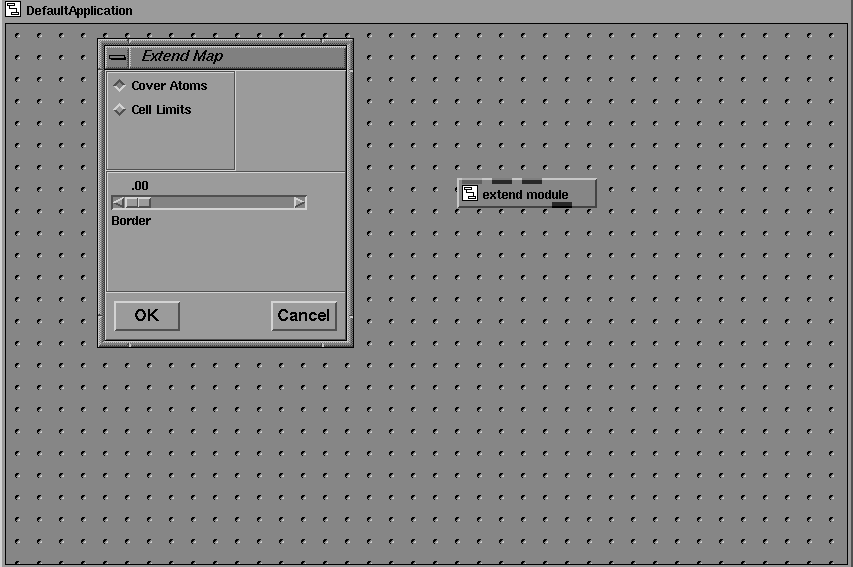
An interface module provides the GUI, and passes input parameters from the on-screen widgets as strings to an output port. The program graphical user interfaces described in reference [8] have been ported from the 'LUI' widget set used in AVS5 to the Motif widget set used by AVS/Express (Figure 3) using the visual interface builder tools provided.
Figure 3 Motif dialog box for the program EXTEND. The macro module shown in Figure 2 is closed to form a single icon in the workspace.
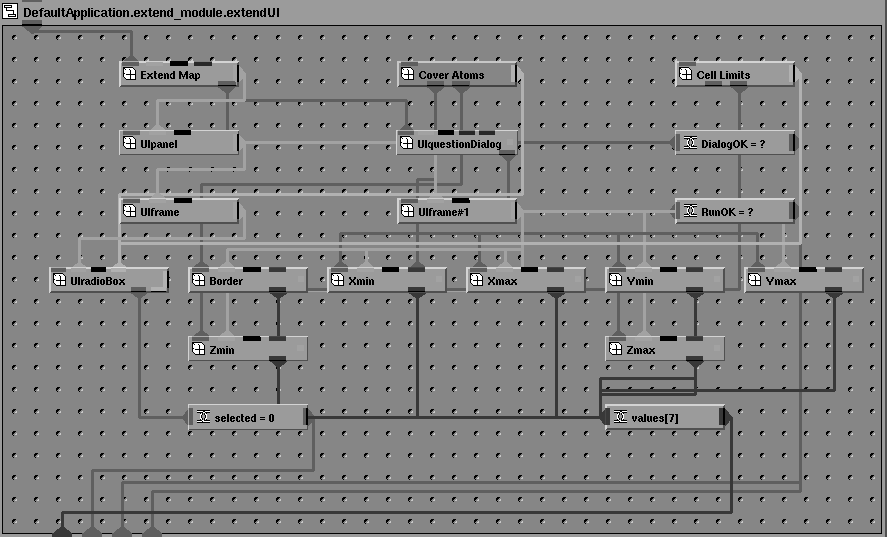
An additional difference between AVS5 and AVS/Express is that in AVS5 the values of input parameters and their interface widgets were tightly coupled and defined in a single source code file. In the AVS/Express implementation the graphical UI components are encapsulated in a separate macro object and the code to translate the input parameters into CCP4 command lines is implemented as a 'method object' (Figures 4 & 5). This means that changes to the CCP4 keyword syntax may be incorporated without changing the interface unless required.
Figure 4 The user interface module for EXTEND. Each of the object icons represents a user interface widget. These can be linked together visually in the Network Editor to construct the user interface.
Figure 5 The program interface module. The user interface widgets shown in Figure 4 are linked to objects representing the input parameters of the program.
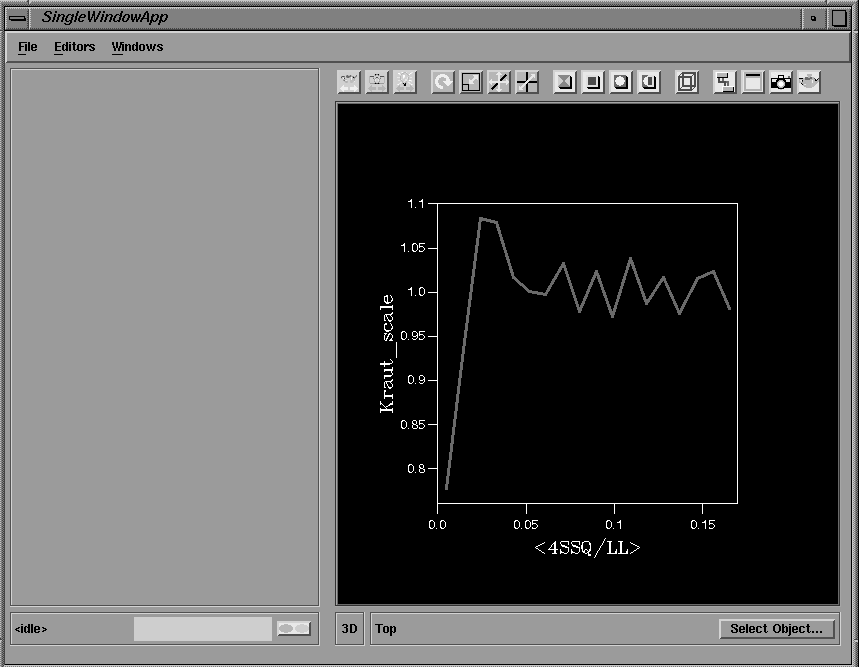
A port of the public domain AVS module "string_to_file" creates a temporary file and passes the strings output by the GUI to this file. An AVS/Express `method object' executes a Unix system() command to run the CCP4 program, with standard input redirected from the temporary file. No changes are required to the CCP4 program code, and the method will also work with programs for which only an executable version is available. Command strings are thus passed from the GUI via a temporary file to the Fortran program. Standard output from the CCP4 program is redirected to another temporary file (the `log file') which is read by an "output filter" module which encapsulates the code of Xloggraph utility distributed with the CCP4 suite and enables graphical output from the program to be displayed directly in the integrated 2D/3D viewer window, as shown in Figure 14. Additional connections allow parameters to be passed into and out of the macro object. A macro object appears in the object palette of the AVS/Express Network Editor as a single module icon, (Figure 6) allowing an encapsulated program to be used individually or linked to other modules in a network.
Figure 6 Objects in the AVS/Express Network Editor Palette. Program macro module objects can be combined with 'native' AVS/Express objects in network.
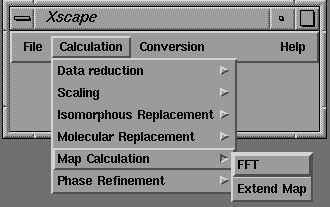
In the AVS/Express environment, connecting two objects together does not necessarily imply data flow between them as in AVS5, but indicates a connection, which may be data flow in either direction or simply a path for change of state notification. This latter distinction makes it easier for our networks to be rerun, when input parameters are changed, than was the case with our AVS5 implementation. Finally, complete networks of objects (representing 'tasks') or individual programs may be executed from a standard Motif pull down menu bar as shown in Figure 7.
Figure 7 Motif pull down menu bar for the completed application.
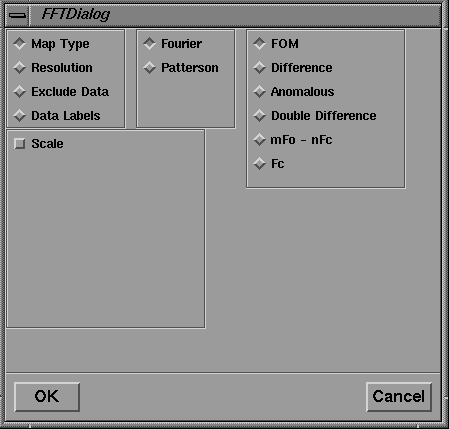
On selection of an option in the pull down menu, the user is presented with a pop-up Motif dialog box, from which input parameters can be selected or entered. (Figure 8).
Figure 8 Motif dialog box for FFT map calculations.
3 Examples
The tutorial will focus on the use of the CCP4 programs and their interfaces in the solution of crystal structures by multiple isomorphous and molecular replacement methods. Examples are drawn from sample scripts and the dendrotoxin data set distributed with the CCP4 suite.
Each macro object representing a single CCP4 program has its own attached graphical user interface (Figure 8). A certain amount of dynamic behaviour may be programmed into the user interface; with related parameters grouped together and only displayed when certain radio buttons or toggles are pressed. The AVS/Express Layout Editor also allows widgets to be reparented and composite user interfaces to be built for networks of modules, whilst hiding widgets corresponding to repeated or unnecessary parameters.
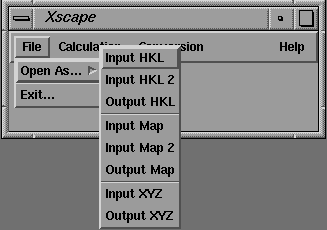
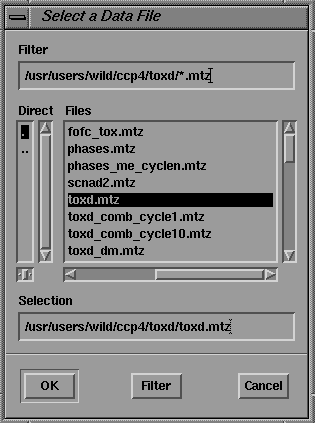
One feature of the CCP4 structure factor file format (MTZ) is that reflection data are stored as columns of real numbers, each referred to by an alphanumeric label (the "data label"). Programs using these data require the user to assign these "data labels" to a set of "program labels" by the use of the LABIN statement The GUI's for programs requiring these assignments use a common method, as illustrated by the interface for SCALEIT shown in Figure 11. The user makes MTZ program/data label assignments in a point-and-click fashion. The user selects the required input and output file types from the File->Open As pull down menu (Figure 9) and selects file names from a standard Motif file browser (Figure 10).
Figure 9 Motif pull down file menu.
Figure 10 Motif file browser.
A read_mtz module opens the MTZ file and reads the ASCII header, which contains the data column labels. These are then presented in a scrollable `choice browser' widget (the lower browser in Figure 11), together with a second choice browser containing a list of the possible data items. By clicking on a choice in the "Data Item" browser, followed by a choice from the "Data Label" browser, the user may set up the necessary correspondences between these items. The data labels chosen in the choice browser widget are immediately displayed in the `type in' widgets.
Figure 11 Input dialog box for the program SCALEIT.
Many CCP4 programs, such as SCALEIT, require certain input commands to be repeated an arbitrary number of times (such as derivative data labels and EXCLUDE commands in SCALEIT). The interface provides a uniform method of dealing with these cases: the user inputs the parameters, clicks on the Accept button and then repeats the procedure for the next set of parameters.
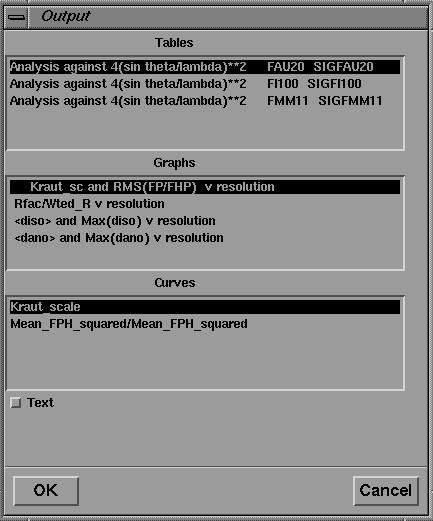
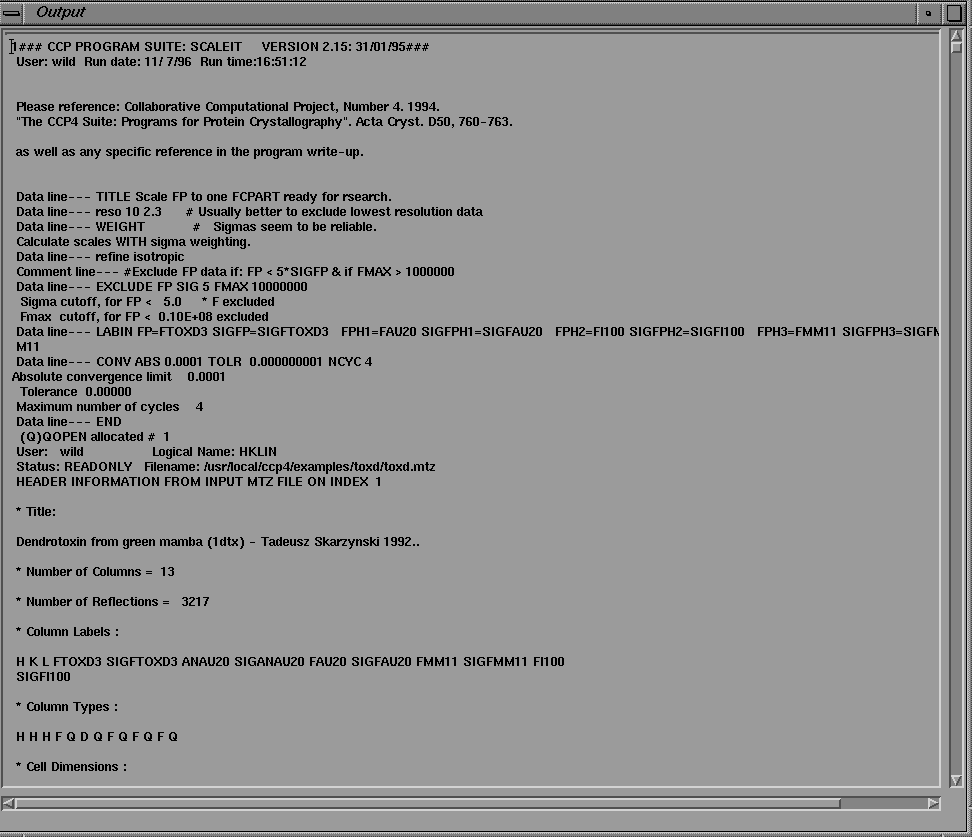
As mentioned above, the function of the GUI is not only to simplify program input, but also to present program output to the user. The program output, read by the Xloggraph module, may be displayed directly in a text browser widget on screen by clicking on the "Text" toggle of the Xloggraph interface (Figure 12).
Figure 12 User interface to the XLOGGRAPH utility. Selected graphs are displayed in the integrated 2D viewer, as shown in Figure 14.
Figure 13 Program output displayed in a text browser window.
A future planned development will be to filter this output to extract summary information, which can then be presented in text widgets in the GUI. The output from a number of CCP4 programs already has tabular statistical information marked with keywords to allow extraction and display as graphs by the Xloggraph utility. Graphical information from these tables is passed directly to the AVS/Express graph viewing tools and displayed in the integrated 2D/3D viewer, providing visual monitoring of the progress of the calculations (Figure 14).
Figure 14 Graphical output displayed in the integrated 2D viewer.
A further possibility is the extraction of significant numerical parameters from the output. These may be passed from the output port of the filter module to the input ports of downstream programs which require them as input, allowing calculations to be automated if no user interaction is required, or giving the user the opportunity to make selections in an interactive manner. In the present version, data may be passed from one stage of the calculation to another by cutting from the text browser widget displaying the output and pasting into a 'type in' widget in another window.
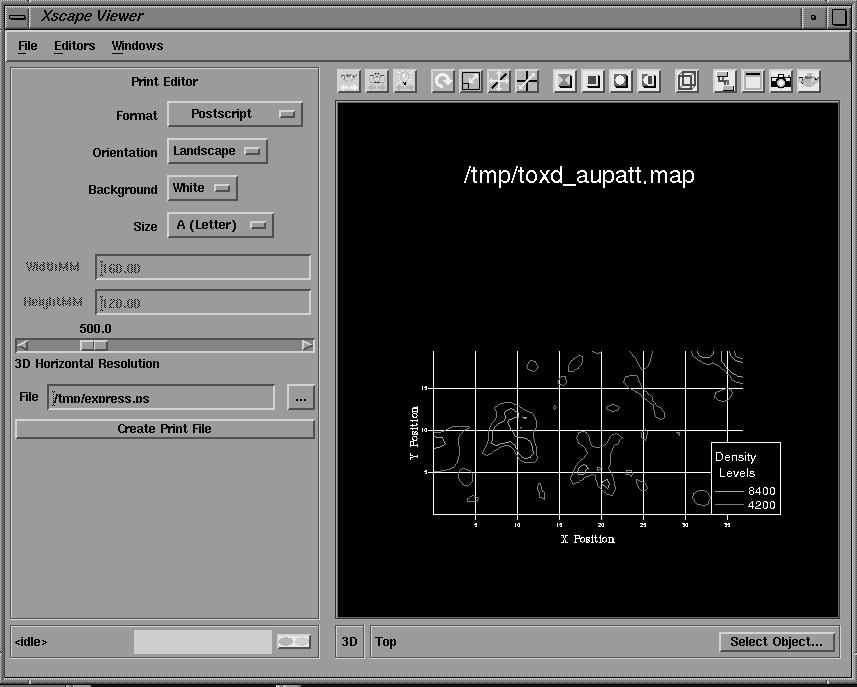
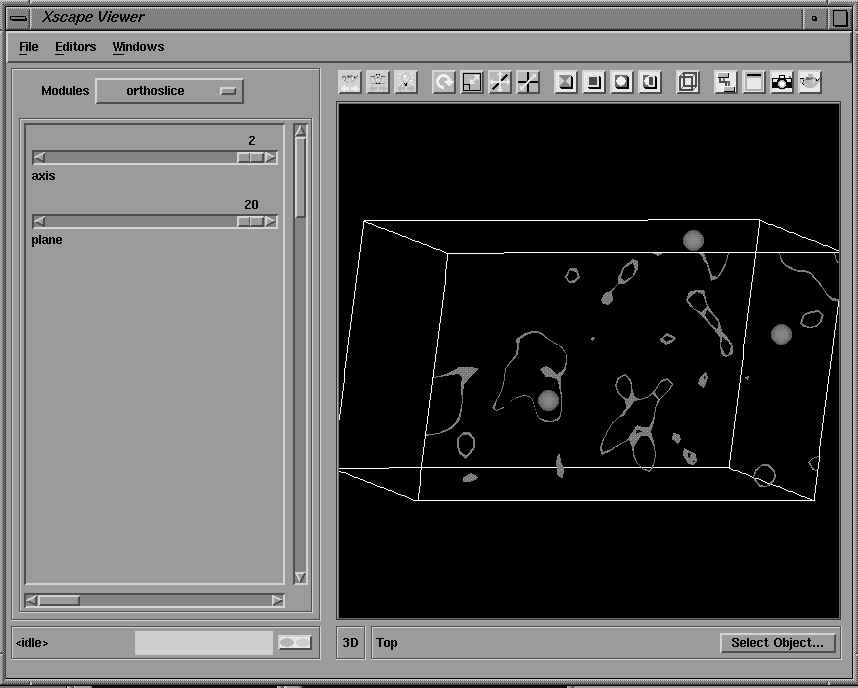
Another advantage of integrating crystallographic programs into the AVS/Express environment is that a number of prepackaged graphical tools are available for the visualization of 2 and 3D data types, including an integrated 2D/3D viewer. The results of crystallographic calculations, such as electron density and Patterson maps, may be visualized with these graphical tools; for example, as 3D solid or wire frame isosurfaces or as 2D contoured sections, and combined with renderings of the molecular structure. A number of modules are available which facilitate the interactive display of any arbitrary contoured section of an electron density or Patterson map. The section number, axis and contour levels may all be varied interactively with sliders and the output displayed in the integrated viewer window either as 2D contoured sections (Figure 15) or as part of a 3D object which can be rotated and translated with the mouse (Figure 16). Hard copy Postscript output may also be obtained.
Figure 15 Contoured section of Patterson map displayed in integrated 2D viewer.
Figure 16 Same section of Patterson map displayed in the 3D viewer. The map volume and positions of predicted Patterson vectors are also shown.
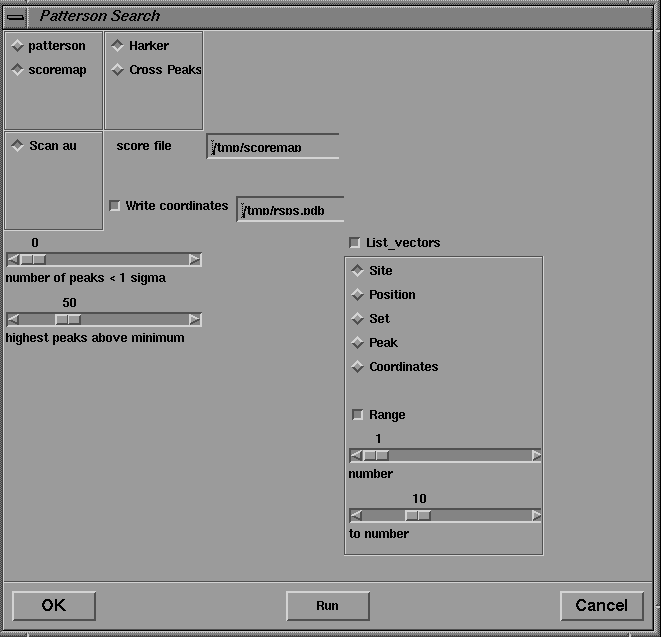
These tools are utilized in the Patterson Search procedures accessed from the Isomorphous Replacement menu. In the present version, the Patterson search is carried out by the CCP4 program RSPS, the interface of which is shown in Figure 17. Since this program, unlike most other CCP4 programs, is designed to be run interactively, a Run button is provided, by which the program can be executed repeatedly without dismissing the dialog box.
Figure 17 User interface for the real space Patterson search program RSPS.
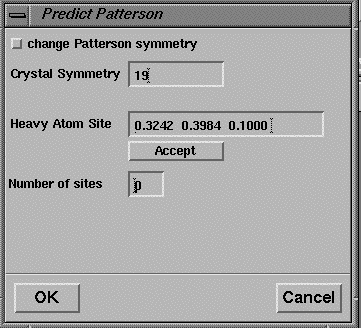
The coordinates of possible heavy atom positions may be extracted from the RSPS output and pasted into the dialog box for the program VECTORS, which is executed via the Isomorphous Replacement->Patterson Search->Predict menu (Figure 18). Additional heavy atom sites can be added by pressing the Accept button.
Figure 18 User interface for the program VECTORS.
The output of this program is a pdb format file containing the coordinates of the predicted Patterson vectors, and these are displayed in the 3D viewer as spheres superimposed on the contoured sections of the Patterson map as shown in Figure 16. The coordinates of the heavy atom site may also be pasted into the user interface of MLPHARE (shown in Figures 19-21) for refinement, and eventually, phase calculation.
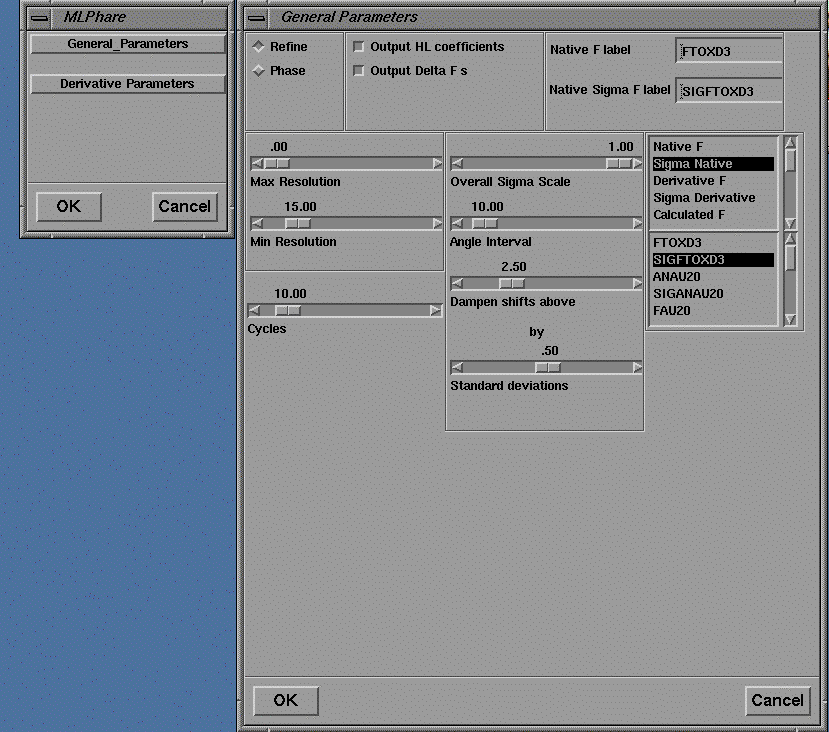
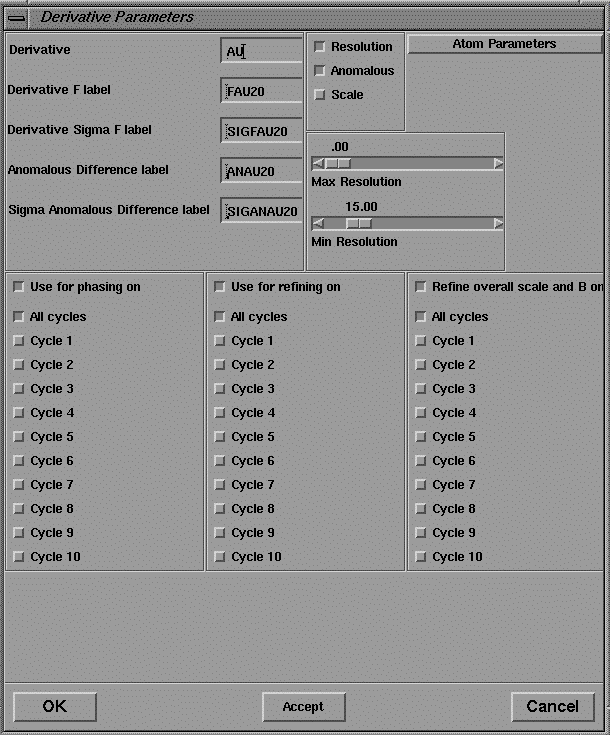
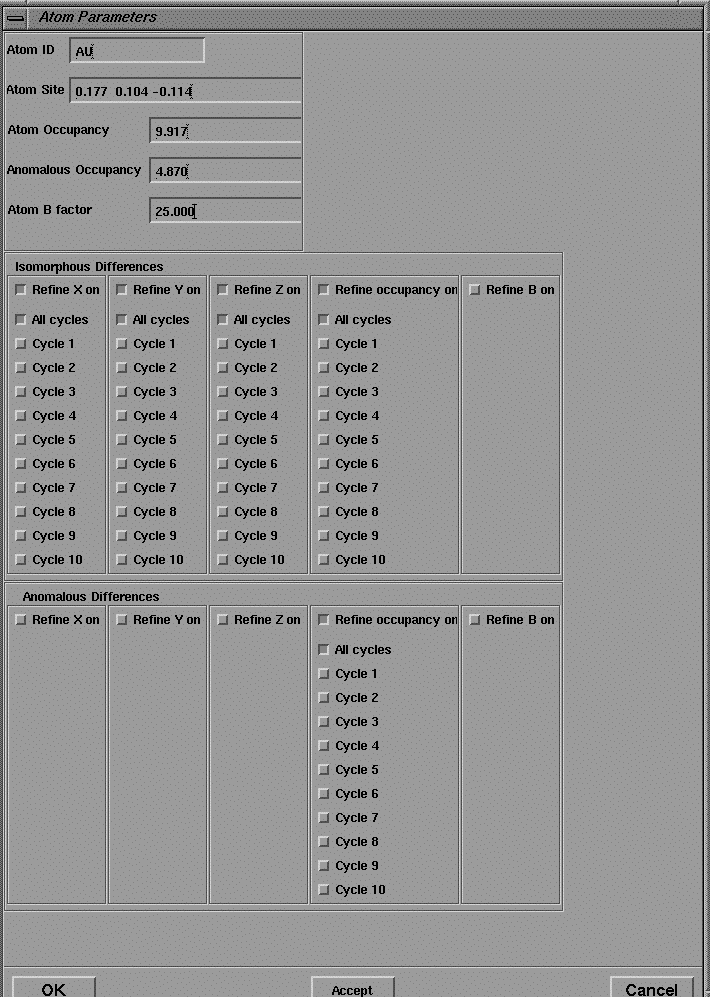
The user interface to MLPHARE comprises separate dialog boxes for parameters which are general, repeated each derivative (by pressing Accept ), or repeated for each heavy atom site within a derivative.
Figure 19 User interface for the program MLPHARE: general parameters.
Figure 20 User interface for the program MLPHARE: derivative parameters.
Figure 21 User interface for the program MLPHARE: atom parameters.
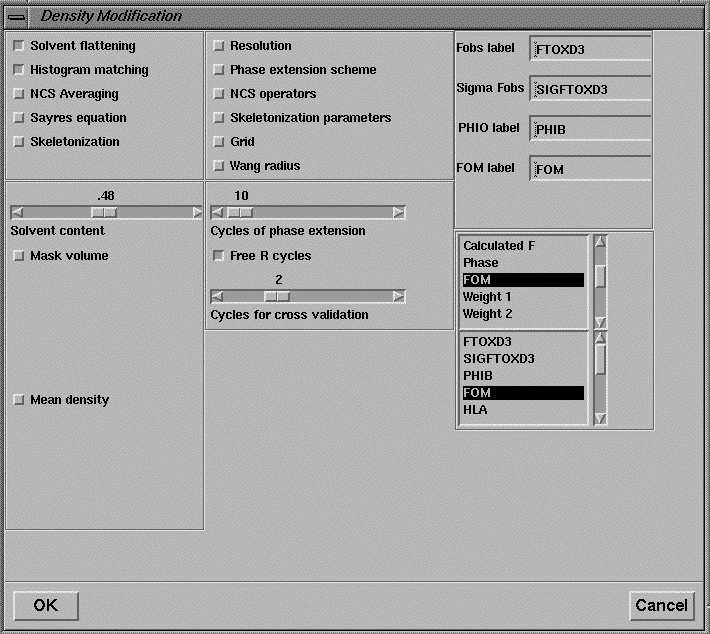
Finally, when a set of isomorphous replacement phases has been obtained, they may be refined by the density modification program DM, the interface to which is shown is Figure 22. The 3D viewer may be used to display electron density maps and solvent masks (not shown).
Figure 22 User interface for the density modification program DM.
Since the process of solving crystal structures by isomorphous replacement is iterative, these procedures may be repeatedly rerun from the interface with different input parameters.
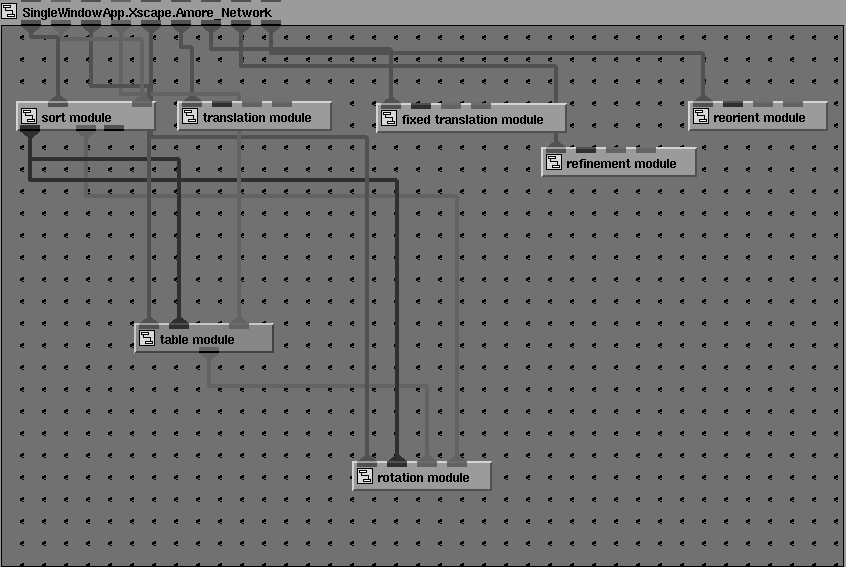
Networks may also be composed of repeated instances of the same module. An example is given in Figure 23, which shows the network for a molecular replacement calculation using the program Amore [12].
Figure 23 Module network for a simple molecular replacement calculation using the program AMORE.
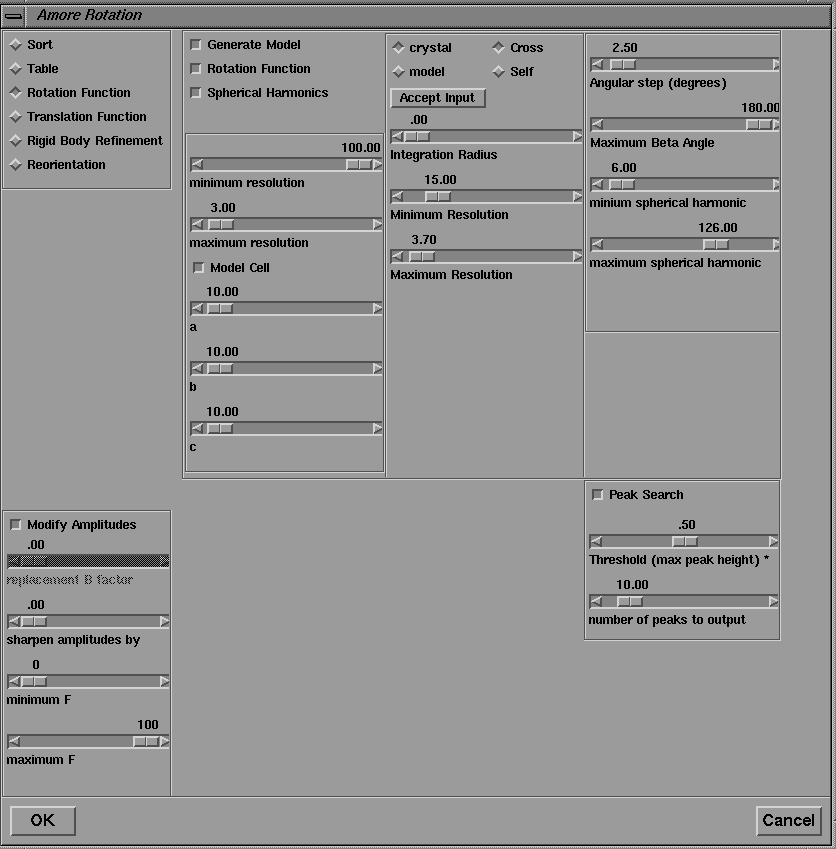
Here the network consists of connected instances of the same module, amore_module , where each instance of the program calls a different function ( Sorting: packs and sorts reflection data; Tabling: transforms coordinates and prepares table of continuous Fourier coefficients; Rotation: calculates rotation function; Translation: calculates translation function; Fixed Translation: calculates translation function with some molecules fixed to search for extra molecules; Fitting: performs rigid-body refinement for selected solutions of translation search; Reorientation: applies appropriate rotation and translation parameters to initial model). Information contained in the output from the Tabling step is used in later stages of the calculation, either to set default values (in the Rotation step), or as input parameters (for example, Centre of Mass and Eulerian Angles in the Reorientation step). In the present version these numbers may be extracted from the program output of the Tabling step, and pasted into 'type in' widgets of the downstream modules which require them. Work is in progress to extract these values automatically and pass them via port connections. Repeated input parameters, such as the minimum and maximum resolution, may also passed downstream. Figure 24 shows the user interface for the rotation function step. Solutions from the rotation function, expressed as Eulerian angles, are extracted from the output of the rotation function step and pasted into the Solution ''type in' widget of the translation function GUI, where they may be added to the input for the translation function calculation by clicking on the Accept Solution button. A similar procedure may be followed for the solutions of the translation function calculation.
Figure 24 User interface to the rotation function step of the program AMORE.
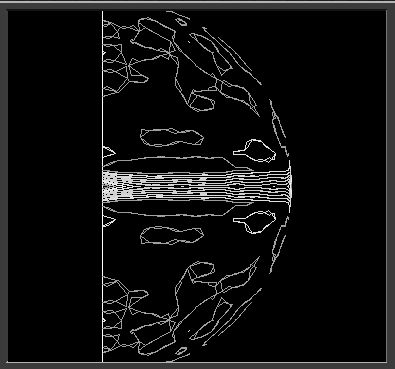
The 3D visualization tools may also be used to display rotation and translation function maps. Figure 25 shows the output from the polar self rotation function calculated by POLARRFN mapped to the surface of a sphere and displayed in spherical polar coordinates.
Figure 25 Self rotation function from the program POLARRFN.
4 Conclusions and further work
It has proved relatively straightforward to integrate programs from the CCP4 crystallographic package into the AVS/Express environment, with no changes to the original source code required. The network architecture provides a natural framework for constructing CCP4 program networks. The provided interface builder tools facilitate the construction of graphical user interfaces for individual programs or networks of related programs, and prepackaged graphical tools facilitate the visualization of the results of calculations. Planned developments include the integration of other Fortran crystallographic programs which expect `card image' input data and produce `line printer' output into the same environment, thus providing alternative methods for the same task. Some possibilities include SHELX [13] and HEAVY [14] for heavy atom search and isomorphous replacement, MERLOT [15] and GLRF [16] for molecular replacement and TNT [17] for refinement. Finally, the AVS/Express developer's edition permits a compiled application to be built which can be distributed as a stand-alone system without the need for AVS/Express to be installed on the user's machine.
References
[1] B. Frenz, "Improved productivity through crystallographic packages" in Crystallographic Computing 5. ed: Moras, D., Podjarny, A.D. and Thierry, J.C., O.U.P, 1991.
[2] D. E. McRee, "A Visual Protein Crystallographic Software System for X11/XView" J. Mol. Graphics Vol 10, pp 44-46, 1992.
[3] Bourne, P.E., Marquess, P.M., and Hendrickson, W.A. "The Crystallographic Workbench" in Collected Abstracts, 15th Congress of the IUCr, MS-02.01.06, 1990.
[4] D. L. Wild, "An X-windows based user interface for protein crystallographic software" (abstract) in Crystallographic Computing 5. ed: Moras, D., Podjarny, A.D. and Thierry, J.C., O.U.P, 1991.
[5] J. Zelinka, "GUI, the data organization and the CCP4 program suite. The Zldb approach" in Joint CCP4 and ESF-EACBM Newsletter on Protein Crystallography, Daresbury Laboratory, 1994.
[6] Collaborative Computational Project, Number 4. "The CCP4 Suite: Programs for Protein Crystallography." Acta Cryst., Vol D50,pp 760-763, 1994.
[7] P. R. Evans, "The CCP4 package program" in Crystallographic Computing 5. ed: Moras, D. ,Podjarny, A.D. and Thierry, J.C., O.U.P, 1991.
[8] D. L. Wild, P. Tucker and S. Choe "A Visual Data Flow Environment for Macromolecular Crystallographic Computing", J. Mol. Graphics, Vol 13, pp 291-298, 1995.
[9] C. Upson, T. Jr. Faulhaber, D. Karnins, D. Laidlaw, D. Schlegel, J. Vroom, R. Gurwitz, A. vanDam, "The Application Visualization System: A Computational Environment for Scientific Visualization", IEEE Computer Graphics and Applications, Vol 9(4), pp 30-42.1989.
[10] AVS Inc., Waltham, U.S.A.
[11] R. Albury, "Dusting off applications" Unix Review, Vol 9(1), pp 40-45, 1991.
[12] J. Navaza, Acta Cryst., Vol A50, pp 157-163, 1994,
[13] G. M. Sheldrick, Acta Cryst., Vol A46, pp 467-473, 1990.
[14] T. C. Terwilliger, S.-H. Kim and D. Eisenberg,"Generalized method of determining heavy-atom positions using the difference Patterson function", Acta Cryst, Vol A43, pp 1-5, 1987.
[15] Fitzgerald, P.M.D. J. Appl. Cryst., Vol 21, pp 273-281, 1988.
[16] L. Tong and M. G. Rossmann, Acta Cryst., Vol A46, pp 783-792, 1990.
[17] D. E. Tronrud, L. F. Ten Eyck and B. W. Matthews, Acta Cryst., Vol A43, pp 489-501, 1987.
These pages are maintained by the Commission Last updated: 15 Oct 2021


![[Commission Home Page] [Commission logo]](https://www.iucr.org/__data/assets/image/0008/149381/cc_textlogo.png)
